Agricultural and Biological Research
RNI # 24/103/2012-R1
Research - (2022) Volume 38, Issue 6
Objective: The objective of this study is to take stock of the reproductive performance of cows with the aim of making it profitable. We are studying cattle breeding, and trying to see if it meets internationally accepted standards.
Methods: A data study was carried out from the period from February to September 2021, in order to collect and analyze data on: the Calving Interval (InC), the Calving Interval-Fertilizing Insemination (InC-FI) and the Calving Interval-first Insemination (InC-1I). Data from nine farms in the Mostaganem region, in our study area, were used, on dairy cows (n=217).
Results: The analysis of the active component allowed us to know that none of the nine farms studied correlates with the accepted norms, from Henzen, Gayrard and Hagen, except farm 02 (n=11). The mean of the farms (n=217) studied in Mostaganem is much closer to the results of Bensalem than the other results obtained by Zineddine, Henzen or Gayrard and Hagen. Only 20% of cows had a calving interval of less than 366 days, while 50% of the dairy cattle studied have an interval between calving exceeding 392 days. A percentage of 30% for farms where the calving-mating interval is between 82 and 104 days and only farm 02 meets the standards.The analyzes of variance showed that the rank of lactation has no significant effect on the first insemination (p=0,40) as well as the first fertilizing insemination (p=0,10). However, the calving interval was considered significant in the three farms studied in relation to the lactation rank (p=0.03).
Conclusions: The evaluation of the fertility parameters of the dairy cattle herd, allowed us to obtain averages which exceed, in the majority of farms, widely accepted standards; these results are mainly linked to the poor management of the reproduction of the cattle herds of the farms in question, which directly influences these studied parameters.
Reproductive performance; Fecundity; Calving interval; Bovine insemination
Dairy cattle farming provides a major part of human food and is a source of profit for producers, but currently in Algeria the latter is not very productive and cannot meet consumer demand because of the insufficient fodder supply and other technical management problems, in this context, the national objective in terms of breeding is to achieve self-sufficiency in animal products, to reduce the import bill for powdered milk, to face demand of the increasing needs of a growing population.
Insemination, artificial or natural, has the first objective is to obtain a calf alive and viable 275 to 290 days later [1]. This level of profitability depends on better management of reproduction and good control of the postpartum period in dairy cows [2], by carrying out a diagnosis of the reproductive performance of the herd based on the evaluation parameters.
Mostaganem is an agricultural region of Algeria, considered to be an important Algerian dairy basin with a dairy cattle workforce estimated at 20,000 heads. Do dairy cattle farming meet accepted standards? This is the question we asked before conducting our study.
Course of the study
The study is based on the results of the survey we conducted on 9 farms in the region of Mostaganem on a total number of 213 cows, where all the herds included in the study are dairy herds and the majority are imported breeds with high genetic potential (Holstein and Montbeliard), the study was carried out from February until September 2021 (Table 1). The study was approved by the ethics committee of our institution and was designed as a non-randomized study, involving randomly selected farms. Before analyzing data on the reproductive performance of dairy cows from the various farms studied, we used a simple questionnaire filled out with the managers (veterinarians, breeders and farm owners) of these farms who were aware of the study that we are carrying out; there was no contact or experience with the animals studied.
| Farms | Size | Race |
|---|---|---|
| Farm 01 | 9 | Holstein |
| Farm 02 | 11 | Holstein+Montbeliard |
| Farm 03 | 33 | Holstein |
| Farm 04 | 38 | Holstein+Montbeliard |
| Farm 05 | 7 | Holstein+Montbeliard |
| Farm 06 | 5 | Holstein |
| Farm 07 | 87 | Holstein |
| Farm 08 | 23 | Holstein+Montbeliard |
| Farm 09 | 4 | Holstein |
Note: Total size: Holstein (208), Monbeliard (9).
Table 1: Survey data.
Data collection and measurement
Completing the questionnaire allowed us to obtain a retrospective view based on the availability of archived documents in the farms visited: personal registers of breeders which contain dates of mating and dates of calving; reproduction monitoring records available in some farms; as well as individual cow records. Other information was gathered following conversations with breeders (breeds exploited, heat detection, feeding behavior, method of insemination, the causes of reform, the state of health and the presence of diseases, etc.), or by simple observations during the survey (type of stall, building, breeding method) (Table 1).
Statistical analysis
We chose the R software to do the different analyzes, in this case, the Shapiro-Wilk normality test, the Bartlett homogeneity test before doing an analysis of variance and post hoc Tukey test for the data in relationship with the qualitative variable of the lactation rank of the three farms, as well as an analysis of the main component PCA to study the three quantitative variables together of the 9 farms studied compared to each other and to the studies made by Hanzen [3], Gayrard and Hagen [4], Bensalem in Tunisia [5] and Zineddine in western Algeria [6].
The summary statistics
The following figure contains The Summary Statistics for Numeric Variables, using on R the function “numSummary”, this function allows us to get the table of statistics to be reported along with information on missing data (NA), if there are any (Table 2).
| mean | sd | IQR | 5% | 20% | 40% | 60% | 80% | 100% | n | |
|---|---|---|---|---|---|---|---|---|---|---|
| InC.1I | 100.98 | 85.3 | 69 | 35 | 47 | 60 | 87.2 | 138 | 704 | 217 |
| InC.FI | 168.98 | 122.46 | 158.25 | 46.75 | 64 | 104 | 177 | 254 | 704 | 216 |
| InC | 429.9 | 115.06 | 117.25 | 328 | 343.4 | 374 | 419.2 | 499.4 | 976 | 152 |
Table 2: Total global summary statistics for numeric variables.
Principal Component Analysis (PCA)
Despite the low number of data that we used, the analysis of the active component allowed us to have an idea of the positioning of the farms studied and the degree of similarity of their data with accepted standards or other studies of neighboring regions and/or countries. This dataset contains 217 individuals and 4 variables, 1 qualitative variable is considered as illustrative (Farm), the others, Calving Interval (InC), calving interval - first insemination (Inc-1I) and the Calving Interval-Fertilizing Insemination (InC- FI) as quantitative variables.
Study of the outliers: The analysis of the graphs does not detect any outlier.
Inertia distribution: The inertia of the first dimensions, Figure 1 shows if there are strong relationships between variables (InC, InC-FI, InC-1I) and suggests the number of dimensions that should be studied.
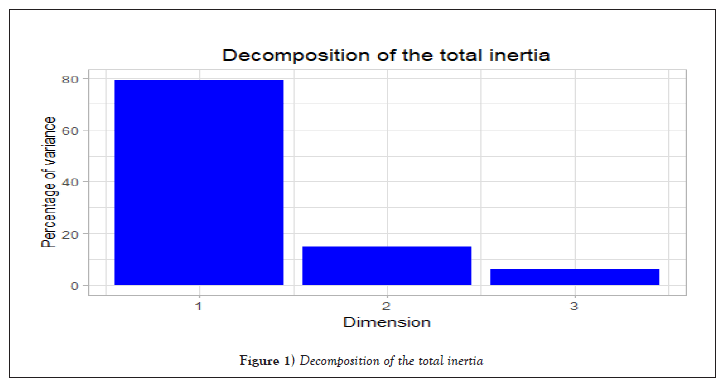
Figure 1: Decomposition of the total inertia.
The first factor is major: it expresses itself 79.27% of the data variability. Note that in such a case, the variability related to the other components might be meaningless, despite of a high percentage (Figure 1). In the PCA summary we have quite high and balanced contributions in the first dimension as already shown in Figure 1. The contributions of the first dimension are represented in detail in Table 3, the contributions of the three variables namely InC.1I, InC.FI and InC are respectively 30%, 36% and 33%. Once again Table 3 confirms that dimension 1 is the best representative of this PCA in our analysis.
| Dim.1 | ctr | cos2 | Dim.2 | ctr | cos2 | Dim.3 | ctr | cos2 | |
|---|---|---|---|---|---|---|---|---|---|
| InC.1I | 0.821 | 29.999 | 0.675 | 0.561 | 66.106 | 0.314 | 0.103 | 3.895 | 0.011 |
| InC.FI | 0.903 | 36.236 | 0.815 | -0.151 | 4.801 | 0.023 | -0.403 | 58.963 | 0.162 |
| InC | 0.871 | 33.765 | 0.76 | -0.372 | 29.093 | 0.138 | 0.32 | 37.142 | 0.102 |
Table 3: Variables of PCA.
At least 80% of the variation is explained by this first eigenvalue (82, 90 and 87% of the variables studied in Dim.1 on (Table 3). A high cos2 indicates a good representation of the variable on the main axes under consideration.
Description of the dimension 1: The labeled individuals are those with the higher contribution to the plane construction (Figure 2). The Wilks test p-value indicates which variable factors are the best separated on the plane (i.e., which one explains the best the distance between individuals). There only is one possible qualitative variable to illustrate the distance between individuals: Farm. The labeled individuals are those with the higher contribution to the plane construction. The individuals are coloured after their category for the variable Farm (Figure 3). The labeled variables are those the best shown on the plane. The rather closed angle between the two variables InC.FI and InC on the PCA circle indicates that these 2 variables are fairly well correlated with each other (Figure 4). The labeled factors are those the best shown on the plane.
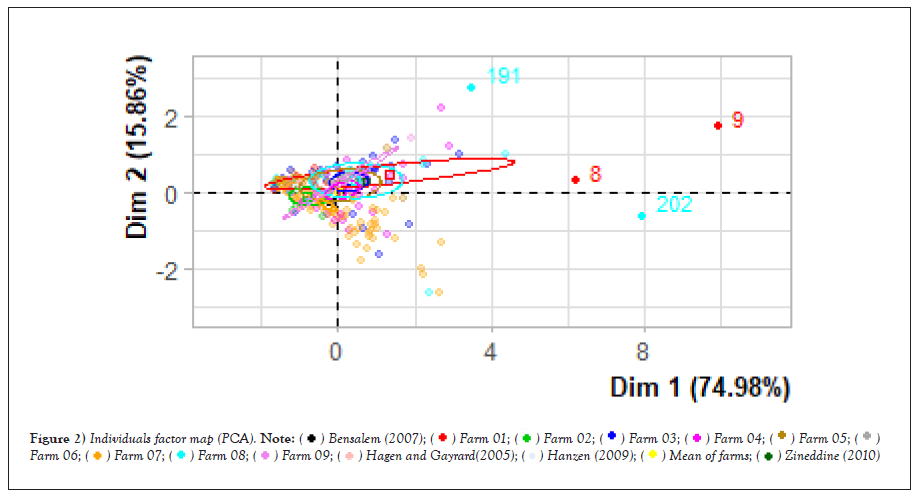
Figure 2: Individuals factor map (PCA).


 .
.
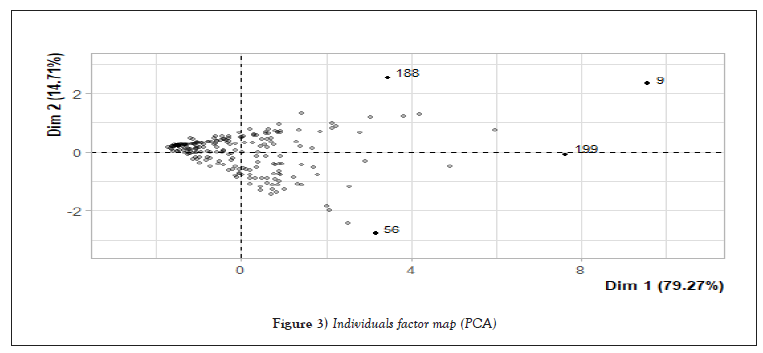
Figure 3: Individuals factor map (PCA).
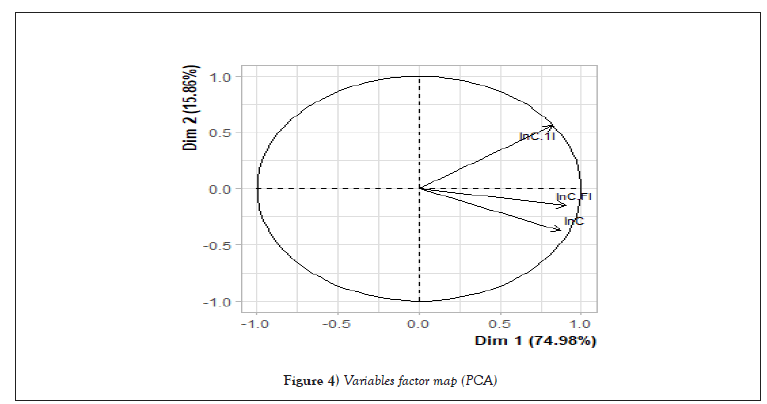
Figure 4: Variables factor map (PCA).
The dimension 1 in Figure 5 opposes individuals such as 8, 9 (Farm 01), 202, and 191 (Farm 08), Zineddine [6] (to the right of the graph, characterized by a strongly positive coordinate on the axis) to individuals characterized by a strongly negative coordinate on the axis, Hagen and Gayrard [4], Hanzen [3] (in the left of the graph), they characterize the group 01.
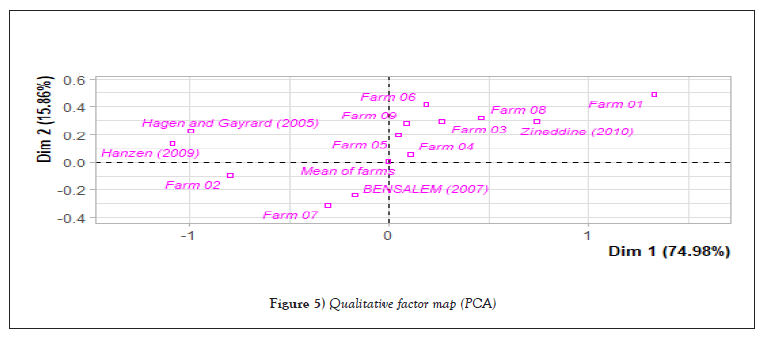
Figure 5: Qualitative factor map (PCA).
The group 2, in which the individuals 202 and 191 (Farm 08) 08, and 09 (Farm 01) stand (characterized by a positive coordinate on the axis) is sharing: High values for the variables InC.FI, InC and InC.1I (variables are sorted from the strongest). The group 3, represented by individuals of Farm 02, Farm 07 means of Hagen and Gayrard [4], Hanzen [3], (characterized by a negative coordinate on the axis, see also the values of Dim.1 on Table 4 of the corresponding farms.) is sharing :Low values for the variables InC.FI, InC and InC.1I (variables are sorted from the weakest) (Table 4).
| Dist | Dim.1 | cos2 | v.test | Dim.2 | cos2 | v.test | Dim.3 | cos2 | v.test | |
|---|---|---|---|---|---|---|---|---|---|---|
| Bensalem | 0.327 | -0.172 | 0.279 | -0.115 | -0.239 | 0.536 | -0.347 | 0.141 | 0.186 | 0.268 |
| Farm 01 | 1.46 | 1.329 | 0.828 | 2.708 | 0.487 | 0.111 | 2.158 | 0.359 | 0.061 | 2.094 |
| Farm 02 | 0.822 | -0.797 | 0.942 | -1.805 | -0.096 | 0.014 | -0.473 | 0.172 | 0.044 | 1.116 |
| Farm 03 | 0.439 | 0.266 | 0.368 | 1.103 | 0.29 | 0.438 | 2.616 | 0.193 | 0.194 | 2.291 |
| Farm 04 | 0.258 | 0.107 | 0.172 | 0.482 | 0.054 | 0.044 | 0.532 | -0.229 | 0.784 | -2.947 |
| Farm 05 | 0.261 | 0.043 | 0.028 | 0.077 | 0.194 | 0.551 | 0.754 | -0.169 | 0.421 | -0.867 |
| Farm 06 | 0.493 | 0.186 | 0.142 | 0.28 | 0.415 | 0.709 | 1.357 | 0.19 | 0.148 | 0.817 |
| Farm 07 | 0.448 | -0.308 | 0.473 | -2.449 | -0.314 | 0.493 | -5.439 | -0.082 | 0.034 | -1.873 |
| Farm 08 | 0.585 | 0.464 | 0.628 | 1.563 | 0.322 | 0.302 | 2.357 | 0.155 | 0.07 | 1.495 |
| Farm 09 | 0.335 | 0.089 | 0.07 | 0.119 | 0.279 | 0.695 | 0.815 | 0.162 | 0.235 | 0.624 |
| Hagen and Gayrard | 1.023 | -0.998 | 0.952 | -0.665 | 0.223 | 0.048 | 0.324 | -0.002 | 0 | -0.004 |
| Hanzen | 1.096 | 1.088 | 0.985 | -0.725 | 0.136 | 0.015 | 0.197 | 0.006 | 0 | 0.011 |
| Mean of farms | 0.014 | -0.005 | 0.1 | -0.003 | 0.008 | 0.318 | 0.012 | -0.011 | 0.582 | -0.021 |
| Zineddine | 0.829 | 0.74 | 0.797 | 0.494 | 0.294 | 0.126 | 0.427 | 0.23 | 0.077 | 0.438 |
Table 4: Supplementary categories of the PCA.
Note that the variables Farm 02, Hagen and Gayrard [4], Hanzen [3], are highly correlated with this dimension (respective correlation of 0.94, 0.95 and 0.98). These variables could therefore summarize themselves the dimension 1 (Figure 5). The mean of the farms studied in Mostaganem is much closer to the results of Bensalem [5] than the other results obtained by Zineddine [6], Henzen [3] or Hagen and Gayrard [4].
Calving interval-first insemination
The analysis of this parameter of the nine farms studied allowed us to obtain an average of 100.98 ± 85.3 (Table 5), which reveals that this criterion is significantly outside the standards accepted by Gayrad and Hagen [4] values proposed by Hanzen [3] which are respectively 70 and 60 days (p<0.0001) it is even higher than that found by Haddada [7] in the Tadla region (Morocco), (78.8 days, p<0.0001).
| mean | sd | IQR | 5% | 20% | 40% | 60% | 80% | 100% | n | |
|---|---|---|---|---|---|---|---|---|---|---|
| Farm 01 | 201.55 | 220.74 | 85 | 27 | 85.2 | 94.8 | 113.2 | 274.2 | 704 | 9 |
| Farm 02 | 60.27 | 32.71 | 25 | 26 | 37 | 48 | 55 | 72 | 144 | 11 |
| Farm 03 | 136.24 | 71.8 | 107 | 22 | 70.4 | 114.2 | 144.6 | 190.6 | 324 | 33 |
| Farm 04 | 105.68 | 74.5 | 99.5 | 35 | 48 | 60.4 | 111.2 | 165.6 | 364 | 38 |
| Farm 05 | 113.28 | 61.03 | 34 | 41 | 87.2 | 92.4 | 101.4 | 132.6 | 235 | 7 |
| Farm 06 | 141 | 11.44 | 2 | 129 | 136.2 | 138 | 138.8 | 144 | 160 | 5 |
| Farm 07 | 63.68 | 24.44 | 30.5 | 30 | 43.4 | 53.4 | 61.6 | 83 | 135 | 87 |
| Farm 08 | 146.86 | 128.37 | 131 | 29 | 47.2 | 71.8 | 124 | 230.8 | 444 | 23 |
| Farm 09 | 126.75 | 102.69 | 69.75 | 46 | 68.8 | 87.2 | 96.8 | 170.8 | 277 | 4 |
Table 5: The summary statistics for numeric variable InC.1I.
These results are close to 116.84 reported by Ghozlane [8] on 8 Wilayas in the North of Algeria. 20% of the cows are put back to breeding after calving before 37 days post-partum in farm 02 and 20% before 43 days for farm 07 (Table 5). These early inseminations reflect the neglect of the voluntary waiting period before performing the first insemination, knowing that no insemination should be performed before the 50th day postpartum because of the low percentage of gestation with which it is accompanied [3]. Across all the farms, only farm 02 and farm 07 have a delay from setting to reproduction which is close to the standards with the averages 60.27 for farm 02 and 63.7 for farm 07 (Table 5). 39.2% of females are inseminated within the optimal period recommended by the literature (40-70 days).
With regard to the herds reared in farm 06, it was observed that 100% of the cows express intervals beyond 90 days with an overall average of 141 days, 70% of the livestock express intervals greater than 90 days in farm 1 and farm 5 with respective averages of 201.55 and 113.28 [8] in their studies on livestock in northern Algeria observes that 25.14% of the animals express an interval greater than 90 days in Sidi Bel Abbes [6], values relatively far from those we observed. According to J.H Britt [2] the fertility of cows decreases beyond 120 days postpartum, which is why these too late inseminations which mean a long voluntary waiting period, or poor heat detection are to be avoided.
Calving-fertilizing insemination interval
This study allowed us to evaluate an average of 168.98 ± 122.46 (Table 2) with a very high variability between cows ranging from 26 to 704 days. This indicates that the latter is significantly far from the objective accepted by Hanzen [3] (p<0.001) which is 85 days and [4] which is 90 days (p<0.001). Compared to the averages found by Boujenane and Aïssa [9] our results are higher than 83.1 found in Morocco (p<0.001). The values obtained seem to be close to those observed by Ghozlane [8] and Haddada [7] which give average values of 128.83 days and 119.2 days respectively, but the differences are still significant (p<0.001).
From the results obtained, we note that farms characterized by a calving-mating interval exceeding 110 days postpartum are in the majority 50% (Table 2). What is very far from the desired objective, this lengthening is explained not only by a delay in the date of the start of reproduction which is an important factor of poor fertility, but also by low success rates in 1st inseminations which can be linked to poor heat detection. The percentage of cows inseminated before 47 days postpartum is 20%, which causes early embryonic mortality. This is undoubtedly related to the management and the professional level of the breeders. A percentage of 30% for farms where the calving-mating interval is between 82 and 104 days and only farm 02 meets the standards with an average of this parameter reaching 89.70 ± 64.27 days (Table 6).
| mean | sd | IQR | 5% | 20% | 40% | 60% | 80% | 100% | n | |
|---|---|---|---|---|---|---|---|---|---|---|
| Farm 01 | 218.66 | 231.39 | 71 | 61.2 | 93.6 | 110 | 113.2 | 314.2 | 704 | 9 |
| Farm 02 | 89.7 | 64.27 | 82 | 30.5 | 43.2 | 55.2 | 79 | 143.6 | 226 | 10 |
| Farm 03 | 162 | 78.74 | 111 | 52.6 | 83.6 | 135.4 | 188.4 | 224.6 | 331 | 33 |
| Farm 04 | 195.81 | 130.07 | 184 | 48.7 | 68.8 | 127.8 | 209.8 | 308.8 | 509 | 38 |
| Farm 05 | 182 | 141.49 | 136.5 | 71.7 | 92.2 | 98.2 | 164.2 | 244.6 | 462 | 7 |
| Farm 06 | 153.2 | 15.99 | 20 | 138.4 | 139.6 | 146.6 | 154.6 | 163.4 | 177 | 5 |
| Farm 07 | 161.83 | 111.65 | 172 | 47 | 67.4 | 96 | 162.6 | 252.8 | 435 | 87 |
| Farm 08 | 179.08 | 161.71 | 161.5 | 43.6 | 61.8 | 93.6 | 156.6 | 275.4 | 674 | 23 |
| Farm 09 | 152.25 | 117.21 | 95.75 | 54.7 | 80.8 | 111.4 | 133.6 | 211.8 | 318 | 4 |
Table 6: The summary statistics for numeric variable InC.FI.
The calving interval
The different intervals between calvings (InC) provided by our results vary according to the farms from 321 to 976 (Table 2) and an overall interval of 429.9 ± 115.06 (Table 2), these results show intervals between calvings significantly higher than what is admitted by Hanzen [3] as well as Gayrard and Hagen [4], which is 365 days (p<0.001), however, it is significantly higher than the result obtained by Boujenane and Aïssa [9] in dairy cattle breeding in the Tadla region in Morocco (385.6 days, p<0.001).
Only 20% of cows had a calving interval of less than 366 days, while 50% of the dairy cattle studied have an interval between calving exceeding 392 days (Table 2), in a similar study [9], find that 39.1% of the animals express intervals less than or equal to 360 days and 30% express intervals of more than 400 days.
With the exception of farm 02, which expresses an average calving interval of 367.6 ± 42.6 (Table 7) which can be considered relatively acceptable, all the other farms express intervals that exceed 391 days, which is far from the objective of producing one calf per cow per year [1].
| mean | sd | IQR | 5% | 20% | 40% | 60% | 80% | 100% | n | |
|---|---|---|---|---|---|---|---|---|---|---|
| Farm 01 | 499.88 | 229 | 91 | 342.6 | 358.2 | 393.2 | 415.6 | 595.6 | 976 | 9 |
| Farm 02 | 367.6 | 42.62 | 34 | 330.6 | 335.4 | 353.2 | 366.8 | 384.2 | 437 | 5 |
| Farm 03 | 444.07 | 90.48 | 109.5 | 329 | 366.2 | 417.2 | 464.8 | 506.6 | 701 | 28 |
| Farm 04 | 401.84 | 54.94 | 100 | 343.8 | 356.8 | 367.8 | 397 | 467 | 500 | 13 |
| Farm 05 | 391 | 61.29 | 59.5 | 343.4 | 353.6 | 367.2 | 391 | 425 | 459 | 3 |
| Farm 06 | NA | NA | NA | NA | NA | NA | NA | NA | NA | 0 |
| Farm 07 | 420.82 | 99.56 | 134.5 | 328 | 340.6 | 370.4 | 401 | 515.2 | 712 | 74 |
| Farm 08 | 451.85 | 159.66 | 126 | 322.9 | 341.4 | 379 | 414.8 | 535.4 | 955 | 20 |
| Farm 09 | NA | NA | NA | NA | NA | NA | NA | NA | NA | 0 |
Table 7: The summary statistics for numeric variable InC.
In addition we observed a percentage of 30% of cows expressing an interval between calving between 342 and 388 days According to Boujenane and Aïssa [9] in Morocco, 35% of cows express intervals between 360 and 420 days, these results are more acceptable compared to the observations made in our farms. The lengthening of this interval can be explained by late breeding, and/or undernourishment. According to Hanzen [3] the longer calving interval obtained in cows could also be explained by heat detection problems that cause insemination failure and silent heats within the herd.
The lactation rank
The analyzes of variance showed that the rank of lactation has no significant effect on the first insemination (p=0.40, Table 8) as well as the first fertilizing insemination (p=0.10, Table 9). However, InC was considered significant in the three farms studied in relation to lactation rank (p=0.03, Table 10 and Figure 6).
| Category | Means | Sd | Groups |
|---|---|---|---|
| L1 | 89.42 | 64.38 | A |
| L2 | 119.42 | 45.05 | A |
| L3 | 160.42 | 102.76 | A |
| L4 | 128 | 85.85 | A |
Table 8: Summary of all pairwise comparisons for InC.1I.
| Category | Means | Sd | Groups |
|---|---|---|---|
| L1 | 89.42 | 64.38 | A |
| L2 | 151.42 | 92.77 | A |
| L3 | 189.14 | 93.3 | A |
| L4 | 188.42 | 71.98 | A |
Table 9: Summary of all pairwise comparisons for InC.FI (Tukey (HSD)).
| Category | Means | Sd | Groups |
|---|---|---|---|
| L1 | 374.42 | 69 | A |
| L2 | 425.42 | 79 | AB |
| L3 | 458.28 | 136.5 | AB |
| L4 | 513.42 | 70 | B |
Table 10: Summary of all pairwise comparisons for InC (Tukey (HSD)).
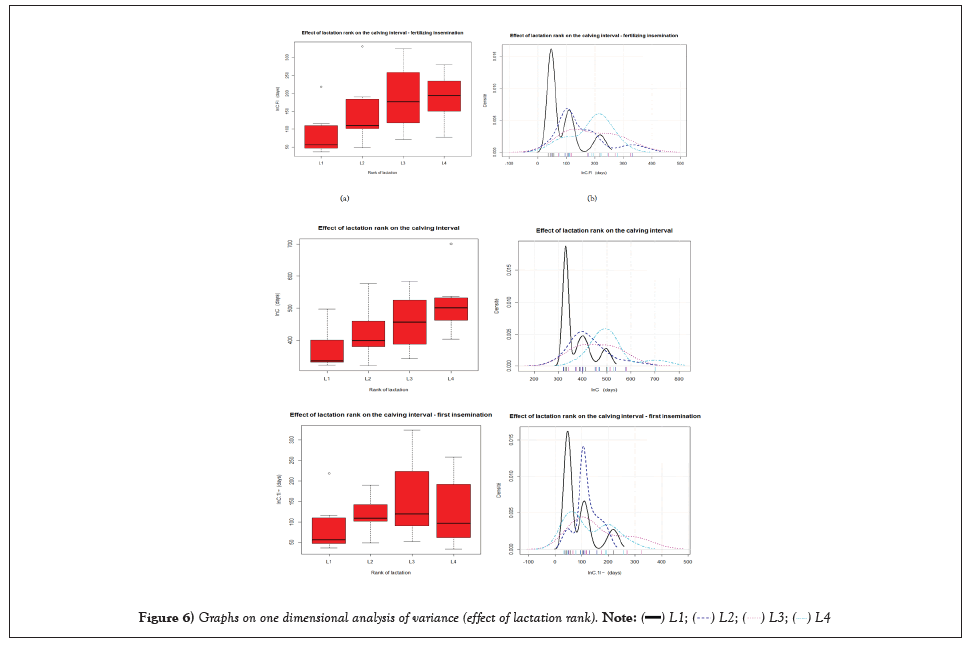
Figure 6: Graphs on one dimensional analysis of variance (effect of lactation rank). .
.
The lengthening of the interval (InC-1I) of 100.98 days depends mainly on the late resumption of the ovarian activity of the cow after parturition (anoestrus) this may be linked to undernourishment after calving which does not favor the return of heat, or perhaps attributable to involuntary reasons such as silent heat, post-puerperal uterine infections which require the cows to be put back to breeding later. The excessive lengthening of the calving insemination to fertilization interval of 168.9 days essentially depends on the number of inseminations which in some cases reaches 6 to 7 times, or other factors such as: the wrong time of the insemination, a wrong location of the semen or the bad technique of the inseminators.
The spread of calvings over the whole year with a high value of 429.9 days is related to all the preceding causes and/or also to the cases of abortions. Within the different herds studied, and according to the analysis of the PCA active component, it seems that farm 02 and farm 07 seem to have better management of reproduction with values of InC.1I, InC. FI and InC more or less close to the accepted values.
The authors thank all the veterinary doctors of the agricultural services for their help and intervention in order to provide us with reliable data and to complete our study. We also thank the two engineers leaving our school NAZEREG and SAHNOUNE for the efforts made in carrying out this study. A big thank you to Doctors BARKA, who participated in this study and in the writing and revision of the manuscript before its submission. Data analysis was performed by LITIM Miloud.
All authors have read and approved the final version.
The research has no conflict of interest.
[Crossref] [Google Scholar] [PubMed]
Citation: Miloud L, Sabrina NN, Rihab SN, et al. Study of fecundity parameters of dairy cows in the region of Mostaganem in Algeria. AGBIR.2022; 38(6):379-385.
Received: 19-Sep-2022, Manuscript No. AGBIR-22-75186; , Pre QC No. AGBIR-22-75186 (PQ); Editor assigned: 26-Sep-2022, Pre QC No. AGBIR-22-75186 (PQ); Reviewed: 17-Oct-2022, QC No. AGBIR-22-75186; Revised: 24-Oct-2022, Manuscript No. AGBIR-22-75186 (R); Published: 01-Nov-2022, DOI: 10.35248/0970-1907.22.38.379-385
Copyright: This open-access article is distributed under the terms of the Creative Commons Attribution Non-Commercial License (CC BY-NC) (http:// creativecommons.org/licenses/by-nc/4.0/), which permits reuse, distribution and reproduction of the article, provided that the original work is properly cited and the reuse is restricted to noncommercial purposes. For commercial reuse, contact reprints@pulsus.com This is an open access article distributed under the terms of the Creative Commons Attribution License, which permits unrestricted use, distribution, and reproduction in any medium, provided the original work is properly cited.
