An International Journal
Agricultural and Biological Research
ISSN - 0970-1907
RNI # 24/103/2012-R1
RNI # 24/103/2012-R1
Research Article - (2025) Volume 41, Issue 4
This study was conducted in Kaffa, Bench Maji and Sheka zones with the objective of assessing livestock feed processing and storage mechanisms in South West Ethiopia. Purposive sampling technique was used to select study districts based on livestock population, accessibility and availability of feed resources. A total of 384 households having a minimum one hectare of land and livestock were randomly selected for interview. The mean total number of cattle in the study area was 8.48 ± 6.79 per households. Majority of the respondents could not practice livestock feed processing and storage mechanisms in dry and wet season in the study area. The bases for feed provision for livestock in the study area were production level, work load and availability of feed ingredients. Different plants parts were used for livestock to increase milk yield, to improve growth rate and to treat diseases. Livestock production was lowest in dry season due to lack of feed shortage in the dry season. Due to this conclusion, government office should give training how to process and store feeds for dry season.
Livestock; Storage; Treatment; Kaffa; Sheka; Bench Sheko
Ethiopia has the largest livestock population in Africa. Despite the highest population, the productivity of Ethiopian livestock is low, and compared to its potential, the direct contribution to the national economy is limited. The productivity of the sector is low mainly due to factors such as poor genetic makeup of local animals, poor nutrition and poor veterinary care among which poor nutrition is the major limiting factor [1]. Feed is the most important input in livestock production and its adequate supply throughout the year is an essential prerequisite for any substantial and sustained expansion in livestock production. These feed resources can be classified as natural pasture, crop residue, improved pasture and forage and agro industrial by-products of which the first two contribute the largest share [2].
Green pasture (55.2%) and crop residues (30.8%) are the main feed types available in the country. The available feed resources in the mixed croplivestock production areas are natural pastures, crop residues, and to a lesser extent, improved forage, concentrates, and nonconventional feeds. Natural pasture is the primary feed source for livestock and is abundant during the rainy season. In some areas, it is harvested during wet seasons and conserved as hay for dry seasons [3]. The role of natural pasture grazing as a major livestock feed resource is diminishing from time to time due to shrinking grazing land size. In highlands of Ethiopia, the annual DM production could satisfy only two-third of the total DM requirements of the livestock due to this, during the dry season animals lose their condition which is an indicator of feed shortage and suggests that livestock production and productivity are constrained by feed scarcity.
A basic shortcoming of the natural grasslands as a source of feed for ruminant livestock is their low production of dry matter due to a combination of the negative effects of inadequate rainfall and soil nutrients. The seasonality of plant growth, which is a reflection of the annual rainfall distribution pattern, further restricts the availability of herbage for the grazing animal to four or five months of the wet season over most of the natural grasslands and the low quality of the herbage is another shortcoming of natural grassland [4].
Various constrain limits the production of the livestock in Ethiopia among which feed resource related problems are the major one. Lack of comprehensive information on regional feed resources, indigenous forage species and feeding systems is one of the important aspects of this issue. Treatment options to achieve optimum utilization or strategic supplementation of crop residues and non-conventional feed resources is not adequately studied and promoted. Feeding guidelines for the different classes of animals and production systems based on available feed resources is limited. Information on nutritional quality of major feed resources is limited. This research might provide detailed scientific document to researchers and brief versatile information to farmers, animal science teachers, students, young entrepreneurs and technicians how to improve livestock productivity. This is the reason, the research was aimed to assess livestock feed processing and storage mechanisms in Kaffa, Sheka and Bench Maji zones of south-western Ethiopia with the following specific objectives [5].
Description of study area
This study was conducted in three zones of SNNPR namely; Kaffa, Sheka and Bench Maji zone. The administrative center of Bench Maji zone is Mizan-Teferi which is found at distance about 561 km from Addis Ababa and 830 km from the regional capital Hawassa. Kaffa is bordered on the south by Debub Omo, on the Southwest by Bench Maji, on the West by Sheka, on the North by the Oromia region, and on the East by Konta. The administrative center of Kaffa is Bonga. Sheka is bordered on the South by Bench Maji, on the West by the Gambela region, on the North by the Oromia region, and on the East by Kaffa. The administrative center of Sheka is Masha. Sheka is the Western part of former Kaficho Shekicho zone [6].
Sample size and sampling techniques
This study was conducted in Kaffa, Sheka and Bench Maji zones of South Western Ethiopia. The study Districts were purposively selected based on livestock population, accessibility and availability of feed resources. From three zones, nine potential districts (three from each zone) were selected based on the information obtained from livestock and fishery development offices in each zone; 27 rural kebeles (three from each district) were purposively selected on the basis of population of livestock and feed resource availability [7]. Then, a total of 384 households were randomly selected from three zones. The required total number of respondents determined by using the formula developed by Cochran for infinite population (infinite population ≥ 50,000).
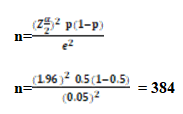
Where,
n=required sample size
Z2 =is the abscissa of the normal curve that cuts off an area at the tails (1α- ) (95%=1.96)
e=is the margin of error (e.g. ± 0.05% margin of error for confidence level of 95%)
p=is the degree of variability in the attributes being measured refers to the distribution of attribute in the population set to the most conservative sample size, p=0.5 and q=1−p=0.5
The numbers of respondents per single selected Kebele determined by proportionate sampling technique as follows;
W=(A/B) × n;
Where;
A=Total number of households living per a single selected Kebele
B=Total sum of households living in all selected sample Kebeles
n=The total required calculated sample size.
Method of data collection
Survey data were conducted to gather information about the livestock feed processing and storage mechanisms in particular zone or district by using a semi-structured questionnaire, observation and interview [8]. The interviews were conducted at farmer’s house with the aid of data collector in the study districts. Information on the socio-economic characteristics of the households (such as sex, age, family size, educational level, number of livestock kept, feed processing, feed storage, etc.) were also collected. Secondary data were obtained from Zonal and District livestock and fishery development offices, books, internet and others.
Data analysis
The collected qualitative data were analyzed by using SPSS version 21 (SPPSS, 2013) software program. This was also employed for descriptive data, which included frequencies, percentages, means and standard errors in the process of describing feed ingredients [9]. The means of quantitative data between study sites were compared by employing One-way ANOVA in SPSS. The differences between means were declared significant at P<0.05. Tukey test was made for mean separation, if there is significant deference [10].
Socio-economic characteristics of the respondents
Household characteristics: Household characteristics of the respondents in the study area were shown in Table 1 [11]. In Sheka zone 91.3% of respondents were male and 8.7% were female. In Kaffa zone 89.6% of respondents were male and the remaining 10.4% were female. Also in Bench Maji zone 94.7% of the respondents were male and the remaining 5.3% were female households. The results of the current work differ from the report of Azage who reported 33% female headed households and 67% male headed household livestock keepers in Addis Ababa. This result also disagrees with the finding of Endale in which about 79% of the respondents were male and 21% female headed households in Meta Robi District of West Shewa.
The marital status in the study area indicated that 96%, 91.2% and 91% of interviewed respondents were married in Sheka, Kaffa and Bench Maji zone, respectively. The remaining respondents were single, divorced and widow in the study area [12].
Most of the respondents in the study area were in primary education level followed by illiterate, secondary and higher education level which was shown in Table 1. From the interviewed respondents 46.8%, 51.2% and 55.6% were in primary education level in Sheka, Kaffa and Bench Maji zone, respectively. This result disagrees to Duguma and Janssens report in which 20.4, 11.1, 21.4, 35.5 and 7.4 % of the interviewed farmers had primary, junior secondary, senior secondary, college and university education in Jimma town, respectively [13].
| Characters | Zones (Frequency/percent) | |||
| Sheka | Kaffa | Bench Maji | Zonal average | |
| Sex | ||||
| Male | 115 (91.3) | 112 (89.6) | 126 (94.7) | 353 (91.9) |
| Female | 11 (8.7) | 13 (10.4) | 7 (5.3) | 31 (8.1) |
| Marital status | ||||
| Married | 121 (96) | 114 (91.2) | 121 (91) | 356 (92.7) |
| Single | 2 (1.6) | 4 (3.2) | 7 (5.3) | 13 (3.4) |
| Divorced | 1 (0.8) | 5 (4.0) | 5 (3.8) | 11 (2.9) |
| Widow | 2 (1.6) | 2 (1.6) | - | 4 (1.0) |
| Education level | ||||
| Illiterate | 39 (31) | 40 (32) | 26 (19.5) | 105 (27.3) |
| Primary education | 59 (46.8) | 64 (51.2) | 74 (55.6) | 197 (51.3) |
| Secondary education | 22 (17.5) | 19 (15.2) | 23 (17.3) | 64 (16.7) |
| Higher education | 6 (4.8) | 2 (1.6) | 10 (7.5) | 18 (4.7) |
TABLE 1 Demographic characteristics of the respondents
Landholding and land use pattern of the households
The mean land holding per household, crop land, pasture land, cash crop and fruit land, fallow land, forest land and forage land of the study area were shown in Table 2. The men total land coverage of Sheka, Kaffa and Bench Maji zones were 5.834, 4.293 and 3.914 hectares per households, respectively [14]. This result shows highest land coverage than Adugna et al., report in which the average land owned per household was 3.3, 5.7 and 1.3 ha at Bikila, Arjo Konan Bula and “Anan Robsan” cooperative located in and around Nekemte town in East Wollega Zone of Oromia regional state of Western Ethiopia, respectively. Endale reported the average total land owned by the households was 3.8 hectares in Meta Robi District of West Shewa zone in Oromia regional state [15]. The average landholding per household in the study area is higher than the national average of 1.18 ha. Total landholding of Sheka zone was significantly higher than that of Kaffa and Bench Maji zones.
| Land resource | Zonal ME ± SD | |||
| Sheka | Kaffa | Bench Maji | Mean total | |
| Crop land | 1.419 ± 0.13b | 1.954 ± 0.13a | 1.665 ± 0.13ab | 1.678 ± 0.08 |
| Pasture land | 2.368 ± 0.19a | 0.463 ± 0.19b | 0.409 ± 0.19b | 1.067 ± 0.11 |
| Cash crop and fruit land | 1.514 ± 0.14a | 1.096 ± 0.14ab | 0.919 ± 0.14b | 1.172 ± 0.08 |
| Fallow land | 0.150 ± 0.06b | 0.372 ± 0.06a | 0.406 ± 0.06a | 0.311 ± 0.04 |
| Forest land | 0.075 ± 0.02b | 0.167 ± 0.02a | 0.195 ± 0.02a | 0.146 ± 0.01 |
| Forage land | 0.308 ± 0.02ab | 0.241 ± 0.02b | 0.320 ± 0.02a | 0.291 ± 0.01 |
| Total land | 5.834 ± 0.56a | 4.293 ± 0.56b | 3.914 ± 0.56b | 4.680 ± 056 |
TABLE 2 Landholding and land use pattern of the households in the study area
There were significant difference on crop land, pasture land, cash crop and fruit land, fallow land, forest and forage land in the study area. The crop land of Sheka, Kaffa and Bench Maji was 1.419, 1.954 and 1.665 hectare, respectively. This result was comparable with Zewdie finding in which 1.1 hectare of land were allocated for crop production in highlands of Debre Birhan, Sebeta and Jimma.
Feed processing/treatment mechanisms
Different feed processing mechanisms for grains and pulses, green fodders and dry fodders in dry and wet season were shown in Table 3. Around 64.6% of the respondents in the study area were not used any processing methods for grains and pulses to feed their livestock in different seasons of the year [16]. This might be due to lack of skill and awareness for farmers how to process feeds to feed their livestock. In contrary to this some farmers used different processing techniques such as grinding, milling, soaking in water, cooking and etc. Addisu et al., stated that chopping, grinding and ensiling with urea are appropriate methods of improving the feed value of crop residues but this mechanisms are not practiced in East Gojjam zone.
| Processing mechanisms | Seasons | |||||||
| Dry | Wet | Overall | ||||||
| Sheka | Kaffa | Bench Maji | Sheka | Kaffa | Bench Maji | Dry | Wet | |
| Processing of grains and pulses | ||||||||
| No processing | 63.5 | 68 | 30.1 | 79.4 | 71.2 | 44.4 | 53.4 | 64.6 |
| Grinding | 4.8 | 10.4 | 19.5 | 4 | 8 | 20.3 | 11.7 | 10.9 |
| Milling | 3.2 | 4.8 | 13.5 | 2.4 | 2.4 | 4.5 | 7.3 | 3.1 |
| Soaking in water | 1.6 | 1.6 | 16.5 | - | 4 | 4.5 | 6.8 | 3.4 |
| Cooking | 1.6 | 0.8 | 6.8 | 0.8 | 2.4 | 7.5 | 3.1 | 3.6 |
| Grinding and milling | 6.3 | 3.2 | 2.3 | 0.8 | 4 | 4.5 | 3.9 | 3.1 |
| Grinding, milling and soaking | 8.7 | 7.2 | 9 | 1.6 | 4 | 9.8 | 8.3 | 5.2 |
| Grinding and soaking | 10.3 | 4 | 2.3 | 9.5 | 4 | 4.5 | 5.5 | 6 |
| Processing of green fodder | ||||||||
| No processing | 72.2 | 55.2 | 27.8 | 72.2 | 60 | 55.6 | 51.3 | 62.5 |
| Chopping | 15.9 | 16 | 57.9 | 19 | 28.8 | 32.3 | 30.5 | 26.8 |
| Soaking | 5.6 | 14.4 | 7.5 | 2.4 | 3.2 | 2.3 | 9.1 | 2.6 |
| Chopping and soaking | 5.6 | 14.4 | 6.8 | 6.3 | 8 | 9.8 | 8.9 | 8.1 |
| Processing of dry fodder | ||||||||
| No processing | 63.5 | 63.2 | 28.6 | 77.8 | 69.6 | 47.4 | 51.3 | 64.6 |
| Chopping | 4.8 | 11.2 | 29.3 | 6.3 | 23.2 | 44.4 | 15.4 | 25 |
| Soaking | 29.4 | 25.6 | 42.1 | 12.7 | 7.2 | 8.3 | 32.6 | 9.4 |
TABLE 3 Feed processing mechanisms in the study area
According to current survey about 51.3 and 62.5% of respondents were not practiced processing of dry fodder in dry and wet season, respectively. Also about 51.3 and 64.6% of respondents were not practiced processing of green fodder in dry and wet season, respectively. Alemayehu reported that urea treatment, chopping and mixing with high quality forages can significantly improve the intake and dietary quality of crop residues [17]. The supplementation of treated or untreated low nitrogen containing basal feeds with forage legumes will increase the nitrogen content of the diet, which is likely to increase feed intake and the rate of degradation of the basal diet in the rumen. Addisu et al., stated that using improved forage crops especially leguminous species with crop residues have an advantage of improving quality, availability and intake of the major feed resources in East Gojjam zone of Amhara region.
Feed storage methods
Different feed storage methods used in the study area were shown in Table 4. According to the current finding majority of the respondents were not practiced storage of grains and pulses. In contrary some respondents practiced storage of grains and pulses in dry and wet season by sun drying, shade drying, by adding preservatives and by using other methods [18]. In Kaffa and Bench Maji around 20 and 29.3% of respondents in dry season store by drying in sun, respectively. Also 27.2% of respondents in Kaffa and 35.3% of respondents store feeds by sun drying in wet season. Addisu et al., stated that collection and storage of crop residues were common but improving utilization efficiency of cereal crop residues through different treatment mechanisms and feed supplementation were not yet practiced and crop residues were not utilized efficiently in East Gojjam.
| Storage methods | Season (percent) | |||||||
| Dry | Wet | Overall | ||||||
| Sheka | Kaffa | Bench Maji | Sheka | Kaffa | Bench Maji | Dry | Wet | |
| Storage of grains and pulses | ||||||||
| Not practiced | 81.7 | 69.6 | 46.6 | 87.3 | 66.4 | 60.9 | 65.6 | 71.4 |
| By sun drying | 7.1 | 20 | 29.3 | 11.1 | 27.2 | 35.3 | 19 | 24.7 |
| By shade drying | 0.8 | - | 6.8 | 1.6 | - | 0.8 | 2.6 | 0.8 |
| By adding preservatives | - | 10.4 | 16.5 | - | 6.4 | 3 | 9.1 | 3.1 |
| Containers used to store grains and pulses | ||||||||
| Not practiced | 80.2 | 72.8 | 39.1 | 95.2 | 72 | 42.9 | 63.5 | 69.5 |
| In clay pot | 8.7 | 16 | 32.3 | 4.8 | 12.8 | 13.5 | 19.3 | 10.7 |
| Plastic container | 2.4 | 3.2 | 6.8 | - | 4.8 | 2.3 | 4.2 | 2.3 |
| Metal container | 2.4 | 0.8 | 0.8 | - | 4.9 | 1.5 | 1.3 | 1.8 |
| Wooden container | 6.3 | 6.4 | 20.3 | - | 6.4 | 36.8 | 11.2 | 14.8 |
| Storage of dry fodders | ||||||||
| Not practiced | 84.9 | 75.2 | 50.4 | 70.6 | 73.6 | 64.7 | 69.8 | 69.5 |
| Bale formation | 12.7 | 10.4 | 36.1 | 22.2 | 24 | 28.6 | 20.1 | 25 |
| Loose | 2.4 | 12.8 | 13.5 | 7.1 | 2.4 | 6.8 | 9.6 | 5.5 |
TABLE 4 Feed storage methods used in the study area
Storing livestock feed in different container are not adapted in the study area as shown in Table 4. According to the current result 69.5, 10.7, 2.3, 1.8, 14.8 and 1% of the respondents were not practiced storing of grains and pules of livestock feed by using clay pot, plastic container, metal container, wooden container and other containers, respectively. Livestock producers practice preparing dry fodders to their animals and uses different storage systems as shown in Table 4. Around 69.5 % of the respondents were not practiced storage of dry fodder and the remaining 25 and 5.5% of the respondent practiced storing dry fodder by making bale and loose, respectively.
Preparing feeds for livestock
In current finding around 66.4% of the respondents could not prepare feed for their livestock in Kaffa, Sheka and Bench Maji zones as shown in Table 5 [19]. About 29.9 and 3.6% of the respondents were preparing livestock feed by their own mechanism and purchase from market, respectively. This might be due to lack of awareness and lack of knowledge of farmers about how to prepare feeds for livestock which is important in improving livestock productivity.
For livestock production different labors were used for different activities that done in the house hold level. About 91.9% of the respondents used family labor to feed, to clean house, to water and to do other activities that related with livestock production.
Feed transportation is one of the tasks in livestock production and management. As indicated in Table 5, 84.9% of the respondents in the study area were transporting inputs to the farm and out puts from the farm by using foots. This result agrees with Endale finding in West Shewa Zone, the common means of transportations are human power and, donkey and horse’s back. Tesfaye and Chairatanayuth also reported the major problems in collecting and storing crop residues in East Shewa zone was transportation problem (35.6%).
| Parameters | Zones (Frequency/Percent) | |||
| Sheka | Kaffa | Bench Maji | Zonal average | |
| How do you prepare concentrate mixture? | ||||
| Not preparation | 95 (75.4) | 84 (67.2) | 76 (57.1) | 255 (66.4) |
| Prepare by own | 29 (23.0) | 40 (32.0) | 46 (34.1) | 115 (29.9) |
| Purchase from market | 2 (1.6) | 1 (0.8) | 11 (8.3) | 14 (3.6) |
| Types of labors used in farm | ||||
| Family labor | 120 (95.2) | 112 (89.6) | 121 (91.0) | 353 (91.9) |
| Casual labor | 5 (4.0) | 9 (7.2) | 8 (6.0) | 22 (5.7) |
| Permanent labor | 1 (0.8) | 4 (3.2) | 4 (3.0) | 9 (2.3) |
| Transporting systems of cut forages/roughages | ||||
| On foot | 108 (85.7) | 102 (81.6) | 116 (87.2) | 326 (84.9) |
| By bajaji | 1 (0.8) | - | - | 1 (0.3) |
| By bicycle | - | - | 1 (0.8) | 1 (0.3) |
| By public transport | - | - | 1 (0.8) | 1 (0.3) |
| By pack animal | 17 (13.5) | 23 (18.4) | 15 (11.3) | 55 (14.3) |
TABLE 5 Preparing feeds, type of labors and transporting feeds for livestock
Future research directions in livestock feed processing, storing and preparing systems: Current research concluded that feed processing, storage and preparing feeds for livestock were not applied as required for their animals due to different reasons. Depending on this in further the following activities should be conducted by the respective bodies;
Above all, we would like to thanks our Almighty God for supplying us health, wisdom and strengths in our work and for his perfect protection and guidance of our life.
Next we would like to extend our gratitude to Mizan Tepi University for financial support and Jimma University Animal Nutrition Laboratory for their technical support to analyze the chemical composition of feed samples.
Mizan-Tepi University covered research budget for data collection.
Behalf of all authors, corresponding author has no conflicts of interest.
Wondimu Woyamo: Data collection and proposal development
Dr. Desalegn Genzebu: Questionnaire preparation and distribution
[Crossref] [Google Scholar] [PubMed]
Received: 10-Jan-2024, Manuscript No. AGBIR-24-124824; , Pre QC No. AGBIR-24-124824 (PQ); Editor assigned: 12-Jan-2024, Pre QC No. AGBIR-24-124824 (PQ); Reviewed: 24-Jan-2024, QC No. AGBIR-24-124824; Revised: 07-Jul-2025, Manuscript No. AGBIR-24-124824 (R); Published: 14-Jul-2025, DOI: 10.37532/0970-1907.25.41(4):1-6


