An International Journal
Agricultural and Biological Research
ISSN - 0970-1907
RNI # 24/103/2012-R1
RNI # 24/103/2012-R1
Research Article - (2025) Volume 41, Issue 6
Agriculture is a science and art of producing crops and rearing animals. It supports the world populations even though highly affected by climate change and variability. Therefore, promoting climate smart agriculture is the solution. Climate Resilience Green Economy (CRGE) fast track project implemented crops and livestock production through climate smart agriculture in the study area. However, no study has evaluated the effect of climate smart agricultural practices or livelihoods of the farmers. This research had the aim of identifying crop and animal production adaptation options and assessing adaptation competence of respondents. In this study, 237 samples households (HHs) were selected and stratified by proportionality allocation to sample into CRGE participant (102 HHs) and non-CRGE group (135 HHs). Data was collected from household survey, key informant and focus group discussions and meteorological data also obtained. The results of 20 years’ trends (1998-2017) of rainfall show that erratic rainfall trends while the temperature was increasing. Crop and animal production income, adaptation level of respondents before and after project and Non-CRGE group mean income in Ethiopian Birr (ETB) was identified. The mean income of HHs before CRGE project was 5,726.10 ETB and after project was 12,943.00 ETB and increased by 7,217.20 ETB. And mean income of non-CRGE group in 2012-2014 and 2015-2017 were 5238 ETB and 5502.5 ETB respectively and increased by only 264.50 ETB. Therefore, the average income due to CRGE fast track investment among CRGE participants was increased by 6952.70 ETB when compared with non-CRGE group. For the reason, adaptation capacity of CRGE fast track participants also increased. Finally, CRGE fast track investment needed for immediate response of adaptation and to diversify source of income. Therefore, promoting CRGE fast track is important since it promotes climate smart agriculture among small holders.
Adaptation potential; Climate smart agriculture; CRGE; Fast track investment
CCAES: Climate Change Agriculture Food Security; CRGE: Climate Resilent Green Economy; CSA: Climate Smart Agriculture: ETB: Ethiopian Birr; FAO: Food and Agriculture Organization of United Nations; FDRE: Federal Democratic Repubilic of Ethiopia; FGD: Focus Group Discussion; FTI: Fast Track Investment; GTP: Growth and Transformation Plan; GWP: Global Warming Potential; HH: Household; IPCC: Intergovernmental Panel on Climate Change; KII: Key Informant Interview; NGO: Non-Governmental Organization; NMA: National Meteorological Agency
Agriculture is a science and art of activities of producing crops and rearing animals that have greatest potential for poverty reduction. Therefore, it is an economic activity which is highly dependent upon weather and climate in order to produce the food and fiber to sustain life. Moreover, it supports world population’s livelihoods across the globe. However, climate change and variability are the challenges which affect productivity of agriculture and overall economy of the world especially in developing countries.
Many sub-Saharan countries are severely exposed to the impact of climate change and variability due to the dominance of rain-fed agriculture. Likewise, Ethiopia is also affected by climate change and variability, because the economy of the country primarily depends on rain fed agriculture. Increasing average temperature and fluctuation of rainfall patterns are already moving Ethiopia to drought and food insecurity. One of the main factors driving these systems is the susceptibility of East African countries results unusual weather patterns such as drought and excessive rainfall and storms to the region including Ethiopia.
Ethiopia remains highly susceptible to climate shocks cause significant humanitarian consequences in the country. Therefore, to solve this problem of climate change and variability, adaptation becomes the instrumental response. Adaptations by small holder farmers have taken as the bench marks for scientific approach. For the reason, adaptation policy designed by considering the knowledge and perceptions of smallholder farmers can bring fruitful and sustainable adaptation response to effects of climate change.
Depending on the impacts of climate change and variability, agriculture requires significant transformation to produce food and Food and Agriculture Organization (FAO) defines, climate smart agriculture as it integrates the three dimensions of sustainable development such as economic, social and environmental by jointly addressing food security and climate challenges. Moreover, climate smart agriculture also includes local knowledge and innovative practices and technologies that promote agricultural productivity and generate income. It includes three major pillars: increasing agricultural productivity, increasing capability at multiple scales and reducing greenhouse gas emissions.
Ethiopian government and other development agencies are united and decided on future agriculture development through expansion and investing on climate smart agricultural practices for community adaptation and to ensure sustainable development. Depending on this, all regions and sectors work towards effective implementation of climate resilient green economy actions aligned to the Growth and Transformation Plan (GTP) provides as a mechanism for fast tracking high priority.
Gidami district is one of the districts found in Kellem Wollega Zone of Oromia Regional state which was selected for climate resilience green economy fast track investment pilot project. Due to small-scale farmers who are dependent on low input and low output rain-fed mixed farming with traditional agricultural technologies dominate in the study area making climate-smart agriculture work as a source of income for the poor, assessing and identifying adaptation of climate smart agricultural practices is important. Therefore, CRGE fast track investment of climate smart agricultural practices on farmers’ land has been implemented by fast track investment fund in Gidami district Alchaya Jilo kebele since 2016. Major climate smart agricultural practices implemented in the study area were crops, livestock production, natural resource conservation and capacity capacitating farmers on their farm level were types of climate smart agricultural practices to the aim of enhancing livelihoods of farmers in the study area.
However, no study has evaluated the effect of climate smart agricultural practices or livelihoods of the farmers. Therefore, the study seeks to show impact of climate smart agriculture in livelihoods of farmer and their adaptations. This study specifically intended to determine farmer’s perception to climate variability and change in the study area, to identify the adaptation option of climate smart agricultural practices on crop and livestock production, to examine the effects of climate smart agricultural practices on crop and livestock production to enhance smallholder’s income and to make comparative analysis between farmers who applied climate smart agricultural practices in CRGE fast track investment project and non-CRGE climate smart agricultural practices [1-4].
Description of the study area
The study was conducted in Gidami district, Kellem Wollega Zone, Western Oromia, Ethiopia. Astronomically the district is located between 8°42’00”N to 9°3’00”N Latitude and 34°12’00”E to 34°33’00”E Longitude (Figure 1). Gidami is located approximately at 688km West of Addis Abeba through Addis Ababa-Nekemt main road. Gidami district is 161 km south of the Kellem Wollega capital zone, Dambi Dollo. Gidami district is bordered in the south by Anfilo District, on the west by South Sudan country, on the east by Jimma Horro district and on the north by Begi District.

Figure 1) Map of the study area
According to Gidami woreda agricultural and natural resource office 2018 data, major agro-ecologies are 8% Dega, 75% Wayne Dega and 17% Kola. Rainy seasons in the district include spring (March-May), summer (JuneAugust) and autumn (September-November). Average annual rainfall of the district ranges between 800-1800 mm and unimodal rainfall.
The temperature ranges from 18-28°C with an average annual temperature of 23°C (Gidami district agriculture and natural resource office data, 2019).
Sampling techniques and sample size
In this study, a multistage sampling technique was employed in Gidami district of Kellem Wollega zone, Oromia regional state. In Gidami district, Alchaya Jilo Kebele was selected and the kebele has a total 587 households. And the total households of the study area were stratified and divided in to two groups based on households included in CRGE fast track investment project and households that were not included in fast track project.
Regarding the sample size, this study was used a simplified formula provided by Yamane to determine the required sample size at 95% confidence level and ± 5% confidence interval.
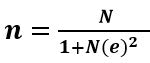
Where n is the sample size, N is the population size (total number of households), and e is the level of precision (sampling error) at 5% significance level.
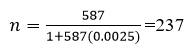
According to this formula, from the total 587 households, 237 sample households were taken for the study. Then, the sample households were proportionally allocated for CRGE households (253) and non-CRGE group (334) households by using probability proportional to the size sampling technique since CRGE fast track project invested on farm level adaptation for CRGE group only and non-CRGE households were not got the investment [5].
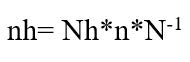
Where: nh=Proportional allocation, N=Total population, Nh=Population within stratum and n=Total sample size
Depending on this formula: 1) Proportionality allocation of sample size for CRGE participant household groups was nh=(253 × 237)/587=102 households sample was taken from CRGE participant households groups.
2) Proportionality allocation sample size for non-CRGE group household’s groups was nh=(334 × 237)/587=135 households sample were selected from NON-CRGE group of households. Finally, using simple random sampling technique (lottery system) 237 HHs were selected from total population of (587 HHs) for the two stratified groups for the household survey data collection.
2) Proportionality allocation sample size for non-CRGE group household’s groups was nh=(334 × 237)/587=135 households sample were selected from NON-CRGE group of households. Finally, using simple random sampling technique (lottery system) 237 HHs were selected from total population of (587 HHs) for the two stratified groups for the household survey data collection.
Both primary and secondary data were used for this research. The primary data was obtained from primary sources including, household survey, field observation, key informant interviews and focus group discussions. The secondary data was also collected from available sources of information such as published and unpublished documents. This includes data from National Meteorology Agency (NMA), Central Statistical Agency (CSA), CRGE directorate Bureau and Regional bureaus of agriculture and natural resources, Zonal and Gidami district’s agricultural office data was used.
Household survey
The household survey was carried out after structured questionnaires was prepared and administered from December 2018 to February 2019.Then, survey was carried with total sample of 237 of this 102 from CRGE participant and 135 from non-CRGE group sample households drawn from the population of Alchaya Jilo kebele. Both closed and open-ended questions were used to collect the required data and the questionnaire was translated into local languages. The questionnaires were administered with the help of six interviewers who can speak and write the local languages. The data collectors were trained to orient them about the purpose of the research, objective of the survey and to instruct in the business of interviewing. Before the actual data collection, ten households from the study area who were not included in the sample households were selected and pre-test of the questionnaires was conducted.
Therefore, the major parts of the questionnaires prepared for the household survey include household demographic characteristics, socio-economic characteristics, local knowledge about crop and livestock production climate smart agriculture practices and its effects in enhancing smallholder’s adaptation potential, about income gained from crop and livestock production in CRGE fast track investment projects and non-CRGE group.
Key Informant Interviews (KII
Key informant in this study refers a person disposes specific competence/ knowledge of climate smart agriculture and its impacts and response due to academic qualifications and many years of work experience. Key informant interview was conducted with farmers who had a good knowledge about the biophysical and socio economic conditions of the area such as: Elders, development agents, local leaders, model farmers, and Agriculture and Natural Development Office experts. Therefore, in this research 2 (two) of Gidami district agricultural and natural resource office experts, two (2) development agents, and two (2) model farmers totally 6 (six) persons were selected and interviews was conducted to cross-check data obtained from household survey and focus group [6]. Furthermore, the interview with key informant used in this research as additional information which was not raised by household interviews about climate smart agricultural practices, the effect of climate smart agricultural practices for adaptation in CRGE project and non-CRGE and the differences of adaptation potential between farmers of stratified groups.
Focus group selection
Focused group discussion helps to generate data at community level and involves a small group of respondents to discuss on issues forwarded by the facilitator who is a skilled focusing on key issues of the research topic. According to Jayasekara, the focus group discussion was based on theme of study and researchers interest. Accordingly, number of participants in FGD and can range from 6 to 12 members. In this study, focus group discussants were selected from representatives of the community including elders, women, and youth groups, totally six (6) focus groups members were organized both from CRGE and non-CRGE participants. Each FGD consists of eight (8) members/participants. The participants for the Focus Group Discussion (FGD) were selected based on experience and having a better knowledge on the present and past environmental, social and economic status of the study area [7]. The major discussion topics were on climate smart agricultural practices, their impacts and adaptation strategies in CRGE participant and non-CRGE group.
Depending on the selection, each group discussed on key issues of the research topic on which forwarded by facilitator. Therefore, one of the elders’ group discussions of the study area showed in the below (Figure 2).

Figure 2) Focus group discussion
Field observations
Observation was made as supportive or supplementary technique for collected data in this research. During data collection, various observation was occurred through data collection process such as: climate smart agricultural practices and its adaptations on the field including individual farmers land that covers with crop residue, vetiver grass grown on soil bund, apiary sites, hand dug wells, farmers level forge demonstration site, forest plantations by CRGE fast track project and other climate smart agricultural practices actions implemented by farmers of the study area [8].
Methods of data analysis
Data of the study area were collected via household survey, key informant interviews, focus group discussions and Gidami district’s station meteorological data of twenty years (1998-2017) were obtained from NMA (National Meteorological Agency) and analysed by using descriptive statistics. The data were also summarized based on the research objectives and entered into Microsoft excel spreadsheet 2013 and finally imported into Minitab version. Crop and animal production mean of the before, after and non-CRGE group were analysed and described by descriptive statistic such as mean and standard deviation. The twenty years’ meteorological data of the district also analysed by calculating the total and the mean of the data and entered in to Microsoft excel line graph and finally the results were interpreted. The implemented climate smart agricultural practices in the study area were crop production options such as access of improved variety seeds, green manuring, row planting, compost preparation and livestock practices options were fattening beef cattle and fattening small ruminants, promoting beekeeping, animal forage development and poultry production. Soil and water conservation practices were traces, area closure and those practices were socially, economically and environmentally friendly sound to the study area. The amount of income that farmers have been got from crop and animal production before and after CRGE project and non-CRGE group were asked. Therefore, the relationship of crop and animal production income difference between CRGE and non-CRGE group were analysed by using ANOVA and descriptive statistical methods. In addition, frequencies, percentiles, graphs, tables, histograms were used [9].
Demographic and socio economic characteristics of sample households
Number of surveyed households by sex and their family: A total of 237 households were interviewed for this study, of which 208 (87.8%) were males and 29 (12.2%) were females. Out of the 208 male households, 87 (42%) were from CRGE participant group, while 121 (58%) were from nonCRGE participant group. Among the 29 female households, 15 females (52%) and 14 females (48%) were from CRGE participant group and NonCRGE group respectively. In CRGE participant and non-CRGE group, male-headed households were dominant in 87.4% representations (Table 1).
| Study area | HHs and their families | Total population of sample households | |||||
| Alchaya Jilo | Male households | Family number | Female households | Family number | Households | Family number | Population |
| Total | 208 | 964 | 29 | 102 | 237 | 1066 | 1303 |
TABLE 1 Number of surveyed households, their family and total populations
Age category of the sample households
Regarding age of the respondents, out of 237 respondents 143 (60.3%) between 41-50 years 51 (21.5%) were between 31-40 years old, 31 (13.4%) 21-30 years 12 (5.06%) were above 51 years old (Table 2).
|
S/N |
Age category |
Total |
Percent (%) |
|
1 |
20-30 |
31 |
13.14 |
|
2 |
31-40 |
51 |
21.5 |
|
3 |
41-50 |
143 |
60.3 |
|
4 |
Above 50 |
12 |
5.06 |
|
Total |
237 |
100 |
|
TABLE 2 Age category of sample households
Marital status of the sample households
When considering the marital status, out of 237 respondents, 222 (93.7%) reported that that they were married, while 5 (2.1%) were divorced, where, 4 (1.7%) were widowed and 6 (2.53%) were unmarried (Figure 3).

Figure 3) Martial statuses of the sample households
Family size of the surveyed households
Concerning the family size of the surveyed households, 119 (50.2%) had 5-7 families where 104 (43.88%) had less than 5 and 13 (5.5%) family size of 8-10 and 1 (0.42 %) had 11-13 family size. More family size was indicated in age category of 5-7 family size as shown below Table 3.
| Family members | Total | (%) |
| <5 families | 104 | 43.88 |
| 5-7 | 119 | 50.2 |
| 08-10 | 13 | 5.5 |
| 11-13 | 1 | 0.42 |
| Total | 237 | 100 |
TABLE 3 Family size of the sample households
Educational level of the sample households
In terms of educational level of the sample households, out of 237 households, 99 (41.8 %) can read and write, 65 (27.4 %) were illiterates and 47 (19.8%) were 1-4 grade, 47 (9.7%) were 5-8 grade and 3 (1.3%) were grade 9-12 (Table 4).
|
Education level |
Total |
(%) |
|
Illiterate |
65 |
27.4 |
|
Read and write |
99 |
41.8 |
|
Grade1-4 |
47 |
19.8 |
|
Grade 5-8 |
23 |
9.7 |
|
Grade 9-12 |
3 |
1.3 |
|
Total |
237 |
100 |
TABLE 4 Education level of sample households
Land holding size of the sample households
Regarding of land holding, the land holding of interviewed households were small and lies between 0.5.1 (ha) up to1(ha) were 121 (51.5%) households while 46 (19.4%) of households had 0.5 ha. And 45 (18.6%) had 1.1-2 ha where, 20 (8.4%) had 2.1-3 ha and 5 (2.1%) represents households with land holding of 3.1-4 ha (Table 5).
| Amount of land size in (ha) | Total | % |
| 0-5 ha | 46 | 19.40% |
| 0.5.1-1 ha | 121 | 51.50% |
| 1.1-2 ha | 45 | 18.60% |
| 2.1-3 ha | 20 | 8.40% |
| 3.1-4 ha | 5 | 2.10% |
| Total | 237 | 100 |
TABLE 5 Land holding size of sample households
Farmers’ perception of climate variability and change in Gidami district
Sample households indicated that they have observed variability in the climate in in terms of increasing temperature, winds and declining precipitation over the past 20 years. Extreme climatic events like floods were observed to have increased in the past 20 years. Such perceptions and understanding of climate change have significant importance in their livelihood for adaptations to climate change. Farmers of the study area were asked whether they perceived long-term climate changes in temperature and rainfall. Accordingly, out of 237 households, (90.7%) were agreed and (5.9%) disagreed while (3.4%) indicated no change on long-term climate change and (94%) were agreed, (3.8%) were disagree and (2%) respondents replied no change on long-term temperature change and (93%) of respondents agreed, (5.5%) disagreed and (1.7%) replied no change on long term change in rainfall and perceived changes in rainfall in terms of its irregularity, uneven distributions and late or early on-set of rainfall are common feature of climate change evidences (Figure 4).

Figure 4) Respondent’s perceptions to climate change in the study area
As shown in the below, respondents were also asked how they knew and learned regarding changes in rainfall. In this regard, 91 (38.4%) were informed about climate change from extension workers and media mainly radio while 57 (24%) from training and workshops, that organized for the target community 56 (23.3%) were informed from extension worker only, 33 (13.9%) were informed from media (radio). The result was in line with the study of FAO (2013) which noted that, climate smart agricultural practices needs awareness to expand among farmers and it needs the involvement of researchers with farmers, land managers, agro foresters, livestock keepers, fishers, resource managers and policy makers (stakeholders) to empower them by means of accessing information for palatable choices to involve to adaptive capacity and resilience on the ground.
In agreement with other studies conducted by Smit, et al. and Nkonya, et al., households with access to formal agricultural extension, farmer-to-farmer extension and information about future climate change are more likely used to adjust their farming practices in response to climate change in the study area (Table 6).
| S. no | Stratified group | Number of respondents and source of information from | Total | |||
| Extension Workers | Media (radio) only | Extension worker and radio | Training | |||
| 1 | CRGE group | 25 (24.5%) | 6 (5.9%) | 33 (32.4%) | 38 (37.3%) | 102 |
| 2 | Non -arag | 31 (30.4%) | 27 (23%) | 58 (43%) | 19 (14%) | 135 |
| Total | 56 (23.6%) | 33 (13.9%) | 91 (38.4%) | 57 (24%) | 237 | |
TABLE 6 Number of households and their source of information
Meteorological information on rainfall and temperature
Rainfall data analyses over Gidami district, study area: Meteorological data of rainfall and temperature were obtained from National Meteorology Agency (NMA) and it was analyzed by using Microsoft Excel by line graph and results interpreted. The analyzed 20 years (1998-2017) climate data results showed that highest annual average rainfall of the district was 1634.4 mm, while the lowest annual average rainfall was 941.5mm. Therefore, similar to the respondent’s perception to climate variability, the rainfal1 trend of the area shows erratic rainfall trend and fluctuations was observed from the analyzed data in the year of 2001, 2003, 2008, 2009, 2014 and 2015 (Figure 5).

Figure 5) Annual trend of mean total precipitation (mm) of the study area
The longest rainy season of the district is from June to August locally called “Ganna” had received the highest amount of monthly average rainfall 222 mm (Figure 6) especially on the month of July and August which is used for agricultural crop production. But “Bona” (dry) season of the district is from December to February which received 10.42 mm of average monthly rainfall especially in February and it is the lowest monthly mean of the rainfall in the district. Therefore, the climate change was observed in terms of the late on-set of rainfall early or late cessation and as well as less and high intensity was observed as similar to the farmers’ perception of the study area.

Figure 6) Average monthly rainfall (mm) of the study area
Temperature data analysis over Gidami district
The highest maximum temperature from the data was 26.25, while the lowest maximum temperature was 23.3. The maximum temperature of the study area shows increasing trend in the year of 2000, 2005, 2009, 2012, 2015, 2016 and 2017 from the data.
As indicated in the (Figure 7), the highest minimum temperature was 13.5 and lowest temperature was 7.63. Therefore, the increasing of minimum temperature additionally indicated the increasing of temperature. Finally, the local perception of farmers in case of increasing temperature and decreasing of rainfall is the same to the meteorological data results in the study area.

Figure 7) Trends of maximum, minimum and average annual temperature ofthe study area.
Fast track investment project in Alchaya Jilo Kebele, Gidami district
Crop production trends and adaptation options: Sample households were interviewed about their income of crop production. Therefore, out of total 237 interviewed most of respondents (70.4%) of households in Non-CRGE used inorganic fertilizer, (5.2%) used organic fertilizer, (13.3%) used both organic and in organic, while (11%) were not used both fertilizers. And (60%) of CRGE participant used both fertilizers, (24.5%) used organic fertilizers, (12.7%) used inorganic fertilizers, while (3%) not used both fertilizers (Figure 8).

Figure 8) Respondents’ category in used fertilizers
The result shows that the respondents in CRGE participant shifts from inorganic fertilizer to using both fertilizers together and finally to organic fertilizers because CRGE fast track project aim was to reduce the use of chemical fertilizer by increasing compost preparation to make environmentally friendly to conserve soil micro-organisms, improve soil nutrient, improve organic matter and improve soil moisture. The impacts of inorganic fertilizers on soil are not as organic since it is chemicals it harms soil micro-organisms and it is costive to use and needs more capital to buy the fertilizers. The result related with study of Parr et al., who stated that, soil microorganisms need organic carbon to live; they get this from eating wood chips, leaves, manures and other organic matter, they create humus which increases soil structure, good for root penetration and development.
The study revealed that lack of precipitation, cash shortage, and lack of awareness on the adaptation technologies were some challenges of adaptation in the study area.
Crop production income of households in the study area
By classifying the crop production year of the study area, into (1) before CRGE project (2012-2014), (2) after CRGE project (2015-2017) and nonCRGE (2012-2017) respondents were asked their income of crop production. Accordingly, crop production mean income of the respondents of CRGE participants after project was 9,748.00 ETB, while income before CRGE was 4,290.00 ETB and this is equivalent to the increment difference of 5,458.00 ETB. The income of non-CRGE group (2012-2014) was 4015.00 ETB, while income of non-CRGE (2015-2017) was 4323.00 ETB, while the increment is only 308.00 ETB (Figure 9).

Figure 9) Crop production mean income of the respondents in ETB
Climate smart agricultural options that increased crop production in the study area
Climate Resilience Green Economy (CRGE) invested on identified options of crop production in fast track investment project for CRGE participant. Respondents were asked how many of them practiced crop production increasing options. Accordingly, out of 102 CRGE participants households, all of respondents 102 (100%) participated on compost preparation, row planting and soil and water conservation practices, while 80 (78.4%) practiced green manuring by CRGE fast track investment project fund. But out of total 135 of non-CRGE group of respondents, only 56 (54.9%) practices compost, 36 (26.7%) practiced row planting, 33 (13.9%) respondents practiced soil and water conservation and 10 (4.2%) practices green manuring (Figure 10).
Non-CRGE group practiced climate smart agriculture from their experience not from CRGE fund but they also use inorganic fertilizers in small amount and soil conservation practices was not properly done as the CRGE group so that soil erosion was one of the main problem that decreased crop production of non-CRGE. But CRGE group used both organic and inorganic together and soil conservation practices was done properly on their own land by fast track project fund. This resulted in the increment of their income. Therefore, the implemented climate smart agricultural practices increased cereal crops production among CRGE fast track project participants. The results also in line with the research conducted by Smith P, et al. who stated that, soil fertility improvement, agronomic practices, overall management of farm helps to reduce nutrient loss and used to promote sustainable agriculture.

Figure 10) Climate smart agriculture practiced used by respondent
Animal production income of the study area
Respondents were asked their three years’ duration of income from cattle, sheep and goat, poultry production, hive product (honey and wax) and each respondent’s income was calculated and the mean income CRGE and nonCRGE was compared. Therefore, mean income of animal production income of after CRGE project was 2255.30 ETB. Because the inputs that increased livestock production were access of modern hives, improved poultry breeds, access of beef cattle, access of sheep and goat for women animal forage development, in CRGE participant, while mean income of respondents from animal production before CRGE project was 1171.90 ETB. The result implies the increment of respondents’ income was 1083.4 ETB. Mean income of animal production in non-CRGE group (2015-2017) was 890.90 ETB, while mean of animal production income of (2012-2014) was 982.00 ETB (Figure 11). The animal production increment in the study area were due to accessing of animal production inputs by fast track investment and capacitating farmers on their farm by CRGE fund as well as housing beef cattle, introducing apiary site and provision of water resource at household’s level in the study area.
Analysis of income from hive product (honey and wax) in the study area
Sample households interviewed about their income of hive product of before CRGE project, after CRGE project and non-CRGE group. Accordingly, honey production income of after CRGE project (2015-2017) was 940.00 ETB and mean income before CRGE fast track project (2012-2014) was 264.20 ETB. Therefore, 675.00 ETB increment was observed. But income from hive product of non-CRGE group of (2015-2017) was 288.60 ETB, while (2012-2014) 241.00 ETB.
The result showed that mean income of honey production of non-CRGE group was decreasing due to limited access of modern hives and with accessories as well as lack of training on beekeeping technology for nonCRGE group and lack of appropriate fund to invest on hive product for non-CRGE group (Figure 11 and Table 7).

Figure 11) Animal production mean income of households in the study area in ETB
| Variable | Total Count | Mean |
| Before CRGE (2012-2014) | 102 | 264.2 |
| After CRGE (2015-2017) | 102 | 940 |
| Non-CRGE (2012-2014) | 135 | 241 |
| Non-CRGE (2015-2017) | 135 | 288.6 |
TABLE 7 Sample households’ income from hive product (honey and wax) in ETB
Factors for crop and animal production reduction in the study area
Respondents were asked about crop animal production reduction of the study area. Accordingly, out of the total 237 respondents, 70 (29.5%) states that late-onset and abnormal distribution of rainfall is one of the major factor decreasing crop and animal production and 53 (22.36%) states sever erosion caused crop production reductions, 35 (14.8%) respondents also replied that soil fertility problem for reduction while 24 (10.21%) were replied that insect pest problem, 21 (8.9%) replied that lack of land, and 18 (7.6%) replied lack of improved crop variety and animal breeds and 16 (6.8%) of them replied that lack of income (Table 8).
| Crop production | Respondent groups | Total | Percent (%) | |||
| Problem of the area | CRGE participant | Percent (%) | Non-CRGE group | Percent (%) | ||
| Sever erosion | 17 | 16.70% | 36 | 26.7 | 53 | 22.36% |
| Lack of land | 10 | 9.80% | 11 | 13.3 | 21 | 8.90% |
| Soil fertility problem | 13 | 27.40% | 22 | 35.6 | 35 | 14.80% |
| Late-onset and abnormal distribution of rain fall | 35 | 24.50% | 35 | 26 | 70 | 29.50% |
| Lack of income | 6 | 13.70% | 10 | 14.07 | 16 | 6.80% |
| Insect pest | 17 | 8.80% | 7 | 10.4 | 24 | 10.21% |
| Lack of improved variety | 4 | 3.90% | 14 | 11.9 | 18 | 7.60% |
| Total | 102 | 100 | 135 | 237 | 100 | |
TABLE 8 Factors of reduction of crop and animal production in the study area
Respondents’ sources of income and their adaptation potential
Respondents’ source of income was analyzed based on their performance of adaptation. Accordingly, out of 237 respondents, 212 (89.63%) were still depend on agriculture as primary source of income, 19 (8.01%) shift their primary sources of income from agriculture to trade due to CRGE fast track investment project, while 6 (2.36%) shifts their primary source other off farm activities such as wood work and metal work. Because after they got income from the fast track project, the CRGE participant motivated to shift their primary source of income to secondary source of income to improve their livelihoods (Figure 12).

Figure 12) Source of income of respondents
These materials' properties significantly differ from others due to increased relative surface area and quantum effects. Important properties of nanoparticles include morphology, hydrophobicity, solubility, surface area, Reactive Oxygen Species (ROS) capacity, and dispersion/aggregation.
Therefore, the CRGE participant respondent’s adaptation impacts shows that, out of 102 respondents 15 (fifteen) respondents shift their primary source of income from agriculture to trade which accounts 6.3% of the 237 respondents total sample, while the non-CRGE group shifts their primary source of income to trade by only 4 (3%).Therefore, the CRGE fast track project impacts double win impact (resilience and income gain) to adapt the changing climate since the participants promoting their life. Therefore, nineteen (19) farmers from Alchaya Jilo kebele shifts from agriculture to trade because of the fast track investment project help them financial capital and social capital.
The result shows that the utilization of production inputs such as modern hives with accessories, access of improved crop variety seeds, providing water sources, access to credit and capacity building by capacitating farmers and investing on farmers’ farm level practices were improve their income and enhance their adaptation potential. Therefore, the findings of this study in line with the study of Hunter, et al. who states that, differential impacts on the livelihoods of human population vary and are largely determined by the location of settlement and levels of income, education and awareness and access to production inputs. Other study conducted by Easterling, et al. states that, adaptive capacity of households and communities is determined by their socio-economic characteristics such as access to financial, technological and information resources, the institutional efficiency within which adaptations occur, human capital, political influence, and kinship networks.
In the study area’ mixed farming, crop and livestock production were dominant practices on which the livelihoods population depends. In the study area, Alchaya Jilo kebele, Gidami district, impacts and adaptation potential of respondents were identified in this research. The respondents were categorized into CRGE (Before and after interventions) and nonCRGE participants. The result indicated that respondents perceived that the increasing of temperature and decreasing of rainfall was observed from the data (1998-2017). Respondents also experienced with erratic rainfall with high intensity which cause hazards. This finding was also in line with the findings of the meteorological results data.
The study result also revealed that crop and animal production in the area after CRGE fast track investment was increased, while the production before CRGE and non-CRGE groups’ increment was small. Because, in the after CRGE fast track project different crop and animal production, climate smart agriculture was invested on the CRGE participant farmers’ farm by CRGE fast track project investment and capacitate them by training and awareness of about climate smart agriculture immediate response. But, nonCRGE group were not get such kind of investment. Moreover, CRGE fast track investment accessed agricultural inputs for participants. Therefore, identified climate smart agricultural high priority options were increased small holders’ adaptation potentials and enhanced their adaptive capacity.
• Farmer’s perceptions to climate variability and change should be used as supplementary source of data in any work regarding residence of climate change.
• Climate smart agricultural practices such as crop and livestock production options should be practiced by smallholder farmers on their own farmland to adapt the changing climate.
• Accessing and promoting adaptable and affordable technologies of crop production disease resistant, early maturing varieties improve smallholder farmers’ income. • Introducing exotic livestock breeds and management is important to increase income of smallholders.
• It is important to build-up the collaboration and network with smallholder farmers and other stakeholders to minimize production problems.
• Establishing weather station and community level early warning is important for adaptations
• Government should aware, create policy, and implement the climate smart agriculture as solution of climate change.
• Government should promote crop and animal production climate smart agricultural practices on farmers’ farm level.
We acknowledge daily workers for their unconditional support in the process of field data collection and as well as Gidami District agriculture and natural resource office for their support.
S.Sh.D wrote the paper and Y.Sh.D prepared tables and figures. All authors read, submitted and approved it for publication.
Funding option is not available.
No additional data is included in the manuscript.
Not applicable (The study does not require testing on animals).
The corresponding author accepts the responsibility for releasing this material.
The authors declare that they have no competing interests.
Citation: Dasa SS, Daka YS. Impact of the fast track investment initiative on household income and its relevance to climate change adaptation in Gidami district, Western Ethiopia. AGBIR.2025;41(6):1-9.
Received: 18-Jun-2024, Manuscript No. AGBIR-24-139304; , Pre QC No. AGBIR-24-139304 (PQ); Editor assigned: 20-Jun-2024, Pre QC No. AGBIR-24-139304 (PQ); Reviewed: 04-Jul-2024, QC No. AGBIR-24-139304; Revised: 10-Nov-2025, Manuscript No. AGBIR-24-139304 (R); Published: 17-Nov-2025, DOI: 10.37532/0970-1907.25.41(6):1-9


