Agricultural and Biological Research
RNI # 24/103/2012-R1
Research Article - (2023) Volume 39, Issue 3
Coffee is a beverage obtained from cherry, the fruit of coffee plant. Grading serves as a process for controlling the quality of an agricultural commodity so that buyer and seller can do business without personally examining every lot sold. This study attempts to apply image processing techniques towards sample coffee raw quality value grading. A total of 145 image datasets and 10,000 coffee beans were used from different grade of coffee plant from ECX Jimma center. The experimental research design was employed. ImageJ tool and Matlab programming language were used. For image preprocessing Gaussian filter to remove noise, contrast enhancement method to enhance the quality of coffee bean image, normalization and binarization by thresholding 8-bit images algorithm to separate image into region in image segmentation process were used. Techniques and algorithms such as ANN, SVM and KNN were used in this study. For the purpose of computing the grading accuracy of datasets, 80% of total dataset were used for training the model and the remaining 20% of dataset were used for testing. The major challenges during conducting this study were keeping the best quality control environment when acquiring images, extracting best features of HSB color feature and the homogeneity of coffee plant bean color features. Hence, appropriate selection of image processing and classification modules paves the way for higher accuracy in the higher-level process for decision making.
Artificial neural networks; Classification; Ethiopian coffee; Grading coffee raw quality; Image analysis; K-Nearest neighbor; Support vector machine
Coffee is a beverage obtained from cherry, which is the fruit of coffee plant. There are various types of coffee in the world. The major economic species are coffee Arabica and coffee Robusta. Coffee Arabica covers 80% of the world coffee trade, and coffee Robusta covers the remaining 19.5% [1]. Coffee Liberica and Excelsa covers less than 1% of world coffee trade [2]. From various coffee types, Ethiopia produces only coffee Arabica, which was originated in the country, Oromia Region, Jimma Zone [3]. Coffee is contributing a great role in the country`s income and taking the lion’s-share of the Growth Domestic Product (GDP) of the country. Coffee is closely associated with the Ethiopian culture.
The study was automating of coffee raw quality grading and grading by image processing techniques. Image processing allows the extraction of useful information from different parameters, and increases the likelihood of determining the grading of different products based on their quality more accurately [4]. Image processing includes image acquisition, preprocessing, segmentation, feature extraction and classification. Image classification is an important task in various fields such as biometry, remote sensing, medical images and grading of agricultural products [5]. In supervised classification, first of all training took place through labeled image data set. The trained classifier model is used to classify new images, but when labeled training data set is not available the unsupervised classification is used for labeling them. Popular classification algorithms include Bayesian, Artificial Neural Network (ANN), K-Nearest Neighbor (KNN), Conventional Neural Network (CNN) and Support Vector Machine (SVM) [6].
Statement of the problem
In Ethiopia, Coffee Grading is performed by using two methods. These grading methods are raw quality or green analysis and liquor value or cup test [7]. Raw quality is computed out of forty percent (40%) and liquor value is computed out of sixty percent (60%) which is cup test (source) [8]. Liquor values assess cup cleanness which is out of fifteen percent (15%), acidity out of fifteen percent (15%), and body (15%) and flavor/character (15%) [9]. Raw quality assesses parameters of shape and make out of fifteen percent (15%), Color out of fifteen percent (15%) and odor out of ten percent (10%) [1]. The added results of these parameters will determine the grade of coffee. In Ethiopia, these methods performed in manual and traditional which were exposing the Grading assessment inconsistent and subjectivism results. This activity is also time-consuming, very expensive, less efficient and less effective which generate less descriptive reason and biased information for grading [10].
Sorting and packing has a significant role for the market of commercial goods. There is a need for automated inspection, as well as identification systems so that the abuses during distribution and marketing can be minimized. For these reasons, it is critical to adopt automatic image processing system which saves time and more accurately in grading of coffee by reducing observer effects of biases determining the quality standard that enhances the commercial needs [11].
Aycheh [11] concluded that, lack of a specialized field of study and qualification for classifying and controlling quality of agricultural product plays a role in affecting grading practices. The cost required to fulfill this gap at various grades of trainings to generate capable experts is also significant. Supporting of the human inspection methods with the consistent result, nondestructive, superior speed, precise and cost-effective computerized system of coffee quality grading and grading is necessary for such agricultural products [9].
Some attempts have been done in order to reduce the gap observed above by different local and foreign scholars. This study was concentrated on designing an effective classification model that can determine the grade of coffee raw quality in Ethiopia.
Objective of the study
General objective: The general objective of this study was to design an effective Ethiopian coffee raw quality grading model using image processing techniques.
Specific objectives
• To develop a model for grading and determining the raw quality value of sample coffee.
• To measure performance of the developed grading models.
Significance of the study: The beneficiaries of this study are Farmers, agricultural experts, coffee exporters and researchers. The output of this research can be an input for other further studies to be done locally as well as globally, as per the recommendation made in this study.
Research design
This study follows experimental research design [12]. To facilitate experimental research in the image domain, we applied image processing steps, such as image acquisition, image preprocessing, segmentation, feature extraction, classification and evaluation (Figure 1).
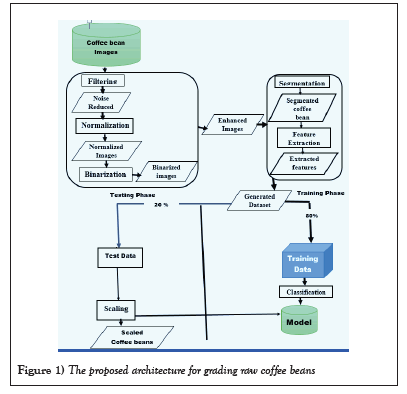
Figure 1: The proposed architecture for grading raw coffee beans.
Data source and sampling technique
In this study purposive sampling technique was used to select domain experts for the purpose of acquiring knowledge [13] and to collect dataset of previous coffee bean images. The selection criterion of domain experts for the study was based on the professions, educational qualification, years of experience on grading practice. A total of 5 domain experts were purposively selected for interview from ECX Coffee grading team, Ethiopia, Oromia, Jimma Zone branch.
There is grade one to five coffee samples in Jimma ECX. Grade one to four were available for gathering from the center. One thousand two hundred fifty sample coffee beans were collected, each weighing 300 gms. This enforces re-sampling of each of the one thousand two hundred fifty samples into twenty-nine sub-samples. A total of one hundred forty-five image datasets and ten thousand coffee beans were used from different grade of coffee (2150 of Grade I, 2655 of Grade II, 3043 of Grade III and 2152 of Grade IV) from ECX Jimma center. The total dataset acquired coffee beans images is presented in the below Table 1.
| Grade | Number of images | Total number of Beans | Processing type |
|---|---|---|---|
| Grade – I | 29 | 2150 | Washed |
| Grade – II | 40 | 2655 | |
| Grade – III | 45 | 3043 | |
| Grade – IV | 31 | Check remaining2152 | |
| Average | 36 | 2,500 | |
| Total | 145 | 10,000 |
Table 1: Total dataset acquired coffee bean images.
Dataset preparation
Image acquisition: Images of coffee bean were taken in to the system by capturing image by using external CANON camera. The classes of the sampled coffee beans were certified by the domain experts in the center`s laboratory. All the captured images were in PNG file format. The below Figure 2 shows the sample coffee beans image capturing environment.
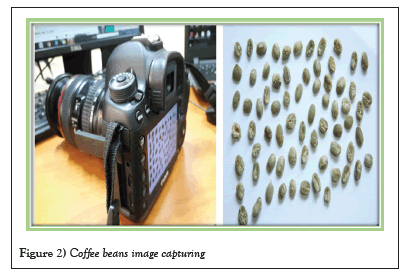
Figure 2: Coffee beans image capturing.
Image preprocessing:Image preprocessing techniques are employed in order to improve the quality of acquired images. In this study were image filtering, image quality enhancement, normalization and Binarization Image preprocessing techniques were used.
Image filtering is used for the purpose of reducing noises from the acquired image data. So, for many practical purposes Gaussian blur can be successfully implemented with simpler filters. Specifically Gaussian blur filtering was used for coffee beans image filtering purpose because of its best performance over the other filtering algorithms like mean and median filtering. Smoothing quality enhancer techniques was also employed for enhancing the quality of images for better understanding of images. Images were normalized and converted in black-white space for further processing and analysis of images.
Image segmentation:In this study, after the image is enhanced and converted in to 8 bits, images were segmented by using histogram-based thresholding technique.
Finally, it was obtained each coffee bean in the image was isolated from the background and labeled in order to ease image analysis from the binarized image.
In summary, thresholding is an important part of image segmentation to create binary images. Binary image analysis is useful for image feature extraction. The task of segmenting background from foreground was done by ImageJ.
Image feature extraction: The study involves the extraction of morphological and color features from digitized images of sampled coffee beans. Color features of the sample coffee beans were extracted from segmented coffee bean images resulting from histogram thresholding. Morphological features have been extracted from the binary images produced by histogram thresholding of the gray grade images of the original coffee bean color images.
Features are used as inputs to the algorithms for classifying the objects into different categories. Pattern recognition can be done by analyzing the morphology (shape and size), color, texture (spatial distribution of color), or a combination of these features of the images. Particle analyzer method of ImageJ was used to extract morphological and color features of the sample coffee. ImageJ conducted the calculation of the features for each coffee bean from the region of interest with in the concern image by giving a unique label for each bean.
Image classification: Classifier is a program that takes input feature vectors and assigns it to one of a set of designated classes. Artificial neural network (ANN) was used for developing classification model in this study. GUI MATLAB R2018a was used for developing model by using ANN classifier.
Implementation tools: All sample coffee bean images were acquired using CANON color digital camera model number EOS 5D Mark III with specification of 26.1 mega pixels, 2.7’’ LCD screen, Carl Zeiss VarioTessar lens with wide-angle lens of 30 mm, optical zoom 4x, full HD 1080. For tasks such as image preprocessing, image segmentation and feature extraction ImageJ was used.
MATLAB with graphical user interface is used for the purpose of developing model and determining the grade of coffee. Based on the model stated, the system could compare for the image taken/uploaded with the image within the database to determine the quality of coffee and will tell us it’s Grade. Finally, the model could determine to what cluster/category the sample coffee bean can be classified.
System evaluation: The model was evaluated by running a test dataset on the classifier built using the training dataset.
Accuracy rate=(Total number of samples correctly classified*100%)/(Total number of samples used for testing)
Experts were selected from office of Ethiopian Commodity exchange at Jimma branch to test the developed prototype.
Experimentation
Coffee bean images that passed through image preprocessing techniques were used in the training phase. In addition to image preprocessing coffee bean images were segmented using histogram-based thresholding methods of image segmentation to identify the Region of Interest (ROI). After identifying the region of interest in the coffee bean images, useful features were extracted in order to reduce the complexity of the computational cost of the model. Sixteen different features, ten morphological and six color features were extracted for training the classification model.
Necessary statistical computations of each coffee beans parameters and features were done to generate simplified and representative data, which support researcher for further development of the final quality determination model. Appropriate classification techniques were applied to differentiate a given coffee bean sample to the appropriate category using the generated data from image as input.
Coffee beans feature representation
There are four categories or classes of coffee, which are Grade I, Grade II, Grade III, Grade IV. The class labels corresponding to names of the grade of a coffee are categorical data. Hence, we represent these values by using binary numbers to simplify the representation that is appropriate to the pattern classifier program.
As indicated in Figure 3, the output vectors which are classes have been represented by using the binary numbers 0 and 1. Since there are four classes that correspond to the predefined rank of coffee beans, there should be 4-bit binary numbers. Each bit refers whether that feature belongs to a rank represented at that bit position. As shown in Figure 3, first, second, third and fourth bit represent First Rank (G-I), Second Rank (G-II), Third Rank (G-III) and Fourth Rank (G-IV) respectively.
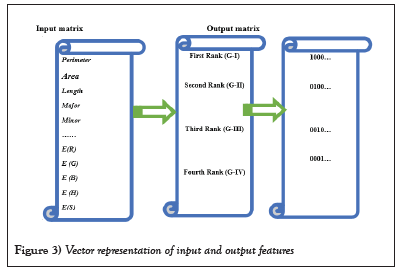
Figure 3: Vector representation of input and output features.
Training and testing process
As indicated in Figure 4, to classify a coffee bean image, first each coffee bean image is taken from a particular rank and labeled with the name of its grade. The process finally generates a model which is the primary input for any decision-making process at testing phase. The model should be used to test the accuracy of the classifier.
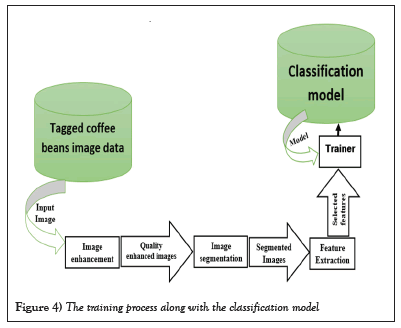
Figure 4: The training process along with the classification model.
As described in Figure 5, an image of coffee bean that is not in the training dataset is used in the testing process. The feature extraction and selection of the testing process was done in the same way as the feature selection and extraction of the training process.
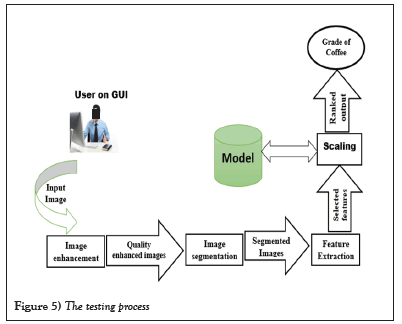
Figure 5: The testing process.
Model development environment
The model was developed and tested on a PC of processor is Intel® core™i5-4200U CPU with 2.30GHz speed, memory (RAM) is 4.00GB of hard Disk capacity, with 64-bit Microsoft Windows 8.1 operating system.
Image preprocessing results
The images were further pre-processed by ImageJ tool and MATLAB R2018a programming language to enhance the retrieval of accurate information. ImageJ is used for image processing, image segmentation and feature extraction. The first tasks were subtracting background from the images to avoid blurs, light distortions and other noises that could be formed due to light effects during image capture and some external objects on the background. After background subtraction, conversion of the RGB images to 8-bit gray grade image and histogram thresholding for the purpose of extracting morphological and color features from the thresholded original images were done by ImageJ. The below Figures 6a and 6b shows the original coffee beans image and the result of Gaussian blurred one.
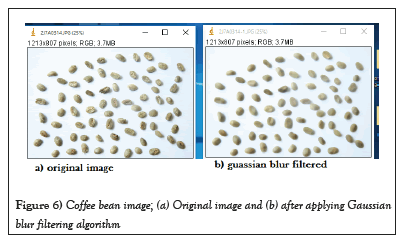
Figure 6: Coffee bean image; (a) Original image and (b) after applying Gaussian blur filtering algorithm.
Image analysis results
ImageJ program performed a great task of image processing, analysis and feature extraction activities of all the captured coffee bean images. Enhanced and segmented coffee bean images were outputs of the research, whereby same were used as inputs for the succeeding phase of feature extraction in the program.
Segmenting coffee bean images
Image segmentation was done to separate each coffee bean images from the background by using thresholding techniques. In this study, histogram-based image thresholding and edge detection are used as they are simple and computationally inexpensive. This task of segmenting background from foreground was done by ImageJ. The below Figure 7 depicts the sample result of segmented coffee beans image using histogram-based thresholding.
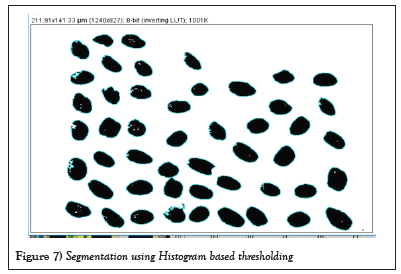
Figure 7: Segmentation using Histogram based thresholding.
Computations of morphological features requires image enhancement and segmentation procedures as the extraction of color features was performed by conducting background subtraction and image thresholding (Figures 8a-8e).
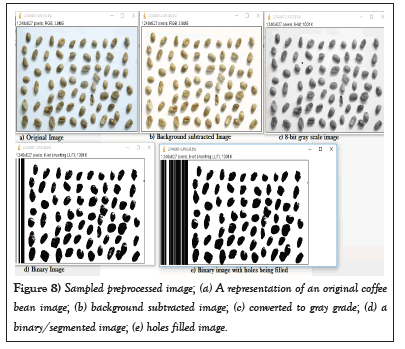
Figure 8: Sampled preprocessed image; (a) A representation of an original coffee bean image; (b) background subtracted image; (c) converted to gray grade; (d) a binary/segmented image; (e) holes filled image.
The HSB color space is widely used to generate high quality of images in computer graphics. It was used to select various different colors needed for identifying particularly coffee bean images. HSB color is important for identifying coffee bean objects as it gives the color according to human perception about the object region. Then it was computed and plotted the histogram of each HSB color as shown in the below Figure 9.
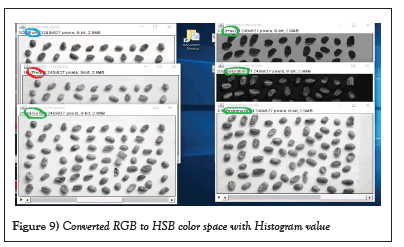
Figure 9: Converted RGB to HSB color space with Histogram value.
Extracted coffee bean features for grading
Morphological and color features of the coffee beans were the focal concern in this research and were extracted accordingly to generate statistical values for raw quality value rank modeling. A sample extracted morphological feature of a coffee bean sample is shown below in Figure 9. The combination of morphological and color feature was used for the purpose of training and testing model. The below Figure 10 shows sample aggregated features of morphological and color features.
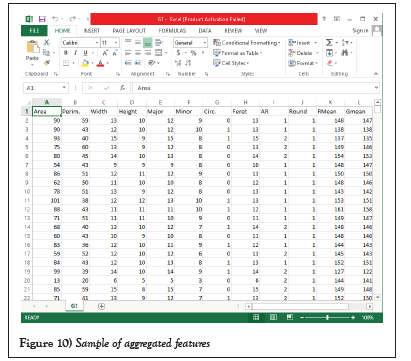
Figure 10: Sample of aggregated features.
Graphical user interface of the model
The first task that should take place is uploading new unknown images by using button represented by query image or query dataset. After uploading new coffee bean image, all processes could be applied on the image or if it is dataset, extracted features were compared with the trained one. The other GUI of the system display the grade of coffee bean image being tested by altering the callbacks functions with enough statistical data. The interface allows deciding the parameters that should be used without rewriting the script and allows fast and efficient grading and grading of coffee bean sample as shown in the above Figure 11.
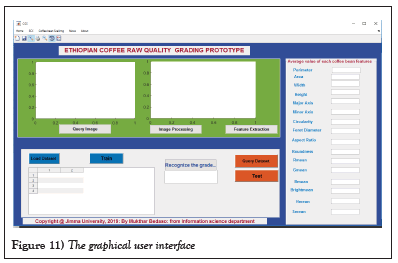
Figure 11: The graphical user interface.
As indicated on the above Figure 12, the final result or recognition of coffee bean is displayed and user is informed about the class of coffee sample provided by the model. After all processes are completed final decision by the model would be showed through result informing or message box with the sample of coffee uploaded. Therefore, this model can help experts in recognizing the cluster under which coffee bean sample should be categorized.
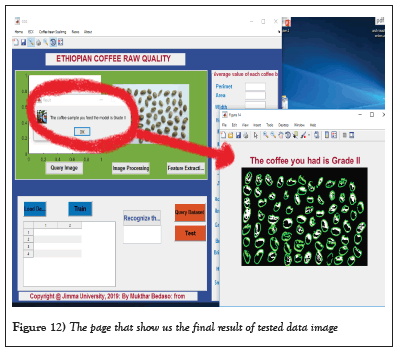
Figure 12: The page that show us the final result of tested data image.
Evaluation
There are two basic phases of classification used in this study. Those are training and testing phases. Data was repeatedly presented to the classifier in the training phase. The trained system is applied to new data to check the performance of the classification in testing phase. Classifier was designed by partitioning the total dataset into training and testing dataset. From the total dataset of each grade, 80% was used for training and 20% was used for testing data. This means that, out of the total 10, 000 datasets, 116 images (with 8000 piece of coffee beans) were used for training and 29 images (with 2000 piece of coffee beans) were used for testing.
Artificial neural network classifier and its output
Using aggregated features: The aggregations were made first taking morphological features followed by color features after testing it in both ways. Sixteen features corresponding to ten morphological features and six color features were used as input to the neural network in this case. There are sixteen neuron numbers for the input layer. After the network was trained using the training data set, the result of the test dataset and its respective confusion matrix was shown in the below Table 2. As shown in the below Table 2 the summary result of artificial neural classifier using both morphology and color feature showed that from the total test of 2000 coffee bean images, 89.45% were correctly classified and 10.55% were misclassified. The percentage of correctly classified instances for each class was shown in the last row of the above Table 2.
| Actual class | Grade-I | Grade-II | Grade-III | Grade-IV |
|---|---|---|---|---|
| Prediction class | ||||
| Grade-I | 403 | 9 | 6 | 0 |
| Grade-II | 12 | 480 | 61 | 13 |
| Grade-III | 14 | 40 | 529 | 41 |
| Grade-IV | 1 | 2 | 12 | 377 |
| Total | 430 | 531 | 608 | 431 |
| Correctly classified (Recall) | 93.70% | 90.39 | 87.00% | 87.47% |
| Correctly classified (Precision) | 96.40% | 85% | 84.70% | 96.1 |
Table 2: Confusion matrix of aggregated features in ANN.
The result of ANN classification using morphology and color feature showed that recall of Grade I, Grade II, Grade III and Grade IV coffees were 93.7%, 90.39%, 87.00% and 87.47% respectively. The result showed that precision of Grade I, Grade II, Grade III and Grade IV coffees were 96.4%, 85%, 84.7% and 96.1% respectively. Grade I coffee registered the highest recall and precision.
In this experimentation all of the three algorithms produce increased classification accuracy in terms of recall and it reflects the property of both features. The analysis result of this experiment yields good performance accuracy. But here also it can be concluded there is a great feature relation between Grade II and Grade III coffee. Color contributes its part on misclassifying Grade I to Grade IV coffee and vice versa, which wasn’t happened in morphological feature experimentation. It was found that aggregated features of morphological and color features are good to use for developing model.
Support vector machine classifier
Using aggregated features: The sixteen features of morphological and color features are combined and used in SVM classifier. After the classifier was trained using the training data set, the result of the test set was shown in the below Table 3. The summarized result of SVM classifier using aggregated feature shows that from the total dataset test of 2000 coffee bean images, 83.75% were correctly classified and 16.25% were misclassified. The percentage of correctly classified instances by class was shown in the below Table 3.
| Actual class | Grade-I | Grade-II | Grade-III | Grade-IV |
|---|---|---|---|---|
| Prediction class | ||||
| Grade-I | 372 | 7 | 5 | 1 |
| Grade-II | 35 | 444 | 91 | 29 |
| Grade-III | 22 | 60 | 493 | 35 |
| Grade-IV | 1 | 20 | 19 | 366 |
| Total | 430 | 531 | 608 | 431 |
| Correctly classified (Recall) | 86.50% | 83.60% | 81.10% | 84.90% |
| Correctly classified (Precision) | 96.60% | 74.12% | 80.81% | 90.14% |
Table 3: Confusion matrix of aggregated features in SVM.
The result of SVM classification using aggregated feature shows that the classification recall of Grade I, Grade II, Grade III and Grade IV coffees were 86.5%, 83.6%, 81.1% and 84.9% respectively. The result shows that the classification precision of Grade I, Grade II, Grade III and Grade IV coffees were 96.6%, 74.12%, 80.81% and 90.14% respectively. Grade I registered the highest recall and precision and Grade IV registered better precision and recall. Grade I coffee accuracy performance was greater than others` and Grade III coffee yields the least accuracy performance under this experimentation.
K-nearest neighbor classifier and its output
Using aggregated features: In this experimentation, the classification input features were sixteen, by combining ten morphological features and six color features. There are also four output classes. As indicated in Table 4, the summary result of KNN classifier using both morphology and color feature showed that, from the total test of 2000 images, 77.85% were correctly classified and 22.15% were incorrectly classified.
| Actual class | Grade-I | Grade-II | Grade-III | Grade-IV |
|---|---|---|---|---|
| Prediction class | ||||
| Grade-I | 340 | 4 | 9 | 16 |
| Grade-II | 53 | 413 | 77 | 27 |
| Grade-III | 34 | 86 | 473 | 57 |
| Grade-IV | 3 | 28 | 49 | 331 |
| Total | 430 | 531 | 608 | 431 |
| Correctly classified (Recall) | 79.10% | 77.77% | 77.79% | 76.79% |
| Correctly classified (Precision) | 92.10% | 72.40% | 72.70% | 80.53% |
Table 4: Confusion matrix of aggregated features in KNN.
The result of KNN classification using aggregated features showed that the classification recall of Grade I, Grade II, Grade III and Grade IV coffees were 79.1%, 77.77%, 77.79% and 76.79% respectively. The result of KNN classification using aggregated features showed that the classification precision of Grade I, Grade II, Grade III and Grade IV coffees were 92.1%, 72.4%, 72.7% and 80.53% respectively. Grade I coffee registered the highest accuracy performance in recall and precision. Under this experimentation most of the images are classified under their respective classes. Under all classifiers, aggregated features produce better accuracy performance over the separate features. But, under this experimentation one thing that can be concluded is color contribute its part on misclassifying another grade to grade I which wasn’t happened in ANN. Here also aggregated features were selected as per its accuracy performance over other features.
Summary of model grading performance
The higher model performance value in ANN is attributed to homogeneous data images like coffee when having very similar data content of datasets. This result of higher model statistical values and lower error rates for performance evaluation tell us, we can implement automated computer inspection system in agricultural sector which can classify products in to various categories using similar dataset and tools. The summary of algorithm performance is shown in the below Table 5.
| Classifiers | Aggregated feature performance (correctly classified) | Overall Average performance (%) | |||
|---|---|---|---|---|---|
| Grade I | Grade II | Grade III | Grade IV | ||
| ANN | 93.7 | 90.39 | 87 | 87.47 | 89.64 |
| SVM | 86.5 | 83.6 | 81.1 | 84.9 | 84.02 |
| KNN | 79.1 | 77.7 | 77.79 | 76.79 | 77.85 |
Table 5: Summary of model grading performance.
The result obtained from all experimentations is promising. Based on different feature content, experiment has been done. In every experimentation ANN yields better performance accuracy and aggregated features produces best accuracy over morphology and color features lonely. Generally based on the accuracy performance, ANN was selected for developing the model.
In this study, different features and classification algorithms are tested to construct classification model. There were ten morphology features and six color features which are sixteen parameters totally. According to the experiments, ANN classifier registered the highest overall average accuracy of 89.64%. This result is found to be good enough by taking worst scenario into consideration.
From experimental result, the discriminating power of morphology feature for Grade I and Grade IV coffee was better than others. This was because by its nature, Grade I and Grade IV coffees were mostly characterized by a unique morphological features shape, roundness and perimeter. Color feature classification result for coffees of Grade I and Grade IV indicates relatively there is better discrimination power than other grade coffees and this confirms to the manual system in which color is used as a parameter of classifying and grading of coffees.
The classification accuracy of Grade I and Grade IV coffee were less discriminated than others. From the labeled Grades, the size and area of Grade II and Grade III are relatively similar and also they inherit color properties. The area and size of Grade I is medium in respective to others. The length, width and area of Grade II coffee and Grade III coffee were relatively similar and this resulted in that some of the coffee beans of Grade II were misclassified as Grade III coffee. Similarly, most coffees of Grade III were misclassified as Grade II. In other words, there is an ambiguity of grading between Grade II and Grade III Coffee beans and also between Grade I and Grade II Coffee beans.
In general, the overall result showed that morphology features have more discriminating power in grading coffee beans than color features and the aggregated feature increases the discrimination power [7]. Work also indicated that aggregated features increase the discrimination power than morphological and color features. The grading accuracy performance of Artificial Neural Network (ANN) is better than Support vector machine and K-nearest neighbor classifiers. The result of this study was modified as per what was proposed to fill the gap different scholars [7] stated. The result difference is due to the increment in morphological features that fully express and represent the real working environment and the current work values difference in coffee.
In this study an attempt is made to apply image processing for grading raw quality of Ethiopian coffee beans. To this end, morphological and color features were extracted from a coffee bean image taken from Jimma ECX center by using image analysis techniques. These features are tested individually and by combining them to construct the classification model by employing Artificial Neural Network (ANN), Support Vector Machine (SVM) and K-Nearest Neighbor (KNN) classifiers. The overall performance of the model in classifying sample coffee bean was 83%. It is concluded that there is a possibility of applying classification of raw quality images of coffee beans using computer inspection system. The major challenges during conducting this study were keeping the best quality control environment when acquiring images, extracting best features of HSB color feature and the homogeneity of coffee bean color features.
Based on the findings of this study, the following recommendations are forwarded.
• In this study an attempt is made to develop raw coffee grading. Further research is required to develop a model for grading roasted coffee beans.
• Identification of coffee varieties from mixed components of coffee beans and computer vision for coffee defect identification and counting are also the other research direction recommended by the researcher.
• The researcher strongly recommends converting paper-based research and creative idea of automating agricultural product (coffee and others) in to problem solving project.
The authors acknowledge Jimma University for allowing budget for this research as well as writing a letter to Ethiopian Commodity Exchange (ECX) where the study was conducted. Moreover, the authors are grateful to the management of the Ethiopian Commodity Exchange (ECX) in this study for providing us with the data (sample coffee beans).
[Crossref] [Google Scholar] [PubMed]
Citation: Bedaso M, Diriba C, Meshesha M. Grading Ethiopian coffee raw quality using image processing techniques. AGBIR.2023;39(3):560-566.
Received: 04-May-2023, Manuscript No. AGBIR-23-97815; , Pre QC No. AGBIR-23-97815 (PQ); Editor assigned: 08-May-2023, Pre QC No. AGBIR-23-97815 (PQ); Reviewed: 22-May-2023, QC No. AGBIR-23-97815; Revised: 29-May-2023, Manuscript No. AGBIR-23-97815 (R); Published: 05-Jun-2023, DOI: 10.35248/0970-1907.23.39.560-566
Copyright: This open-access article is distributed under the terms of the Creative Commons Attribution Non-Commercial License (CC BY-NC) (http:// creativecommons.org/licenses/by-nc/4.0/), which permits reuse, distribution and reproduction of the article, provided that the original work is properly cited and the reuse is restricted to noncommercial purposes. For commercial reuse, contact reprints@pulsus.com This is an open access article distributed under the terms of the Creative Commons Attribution License, which permits unrestricted use, distribution, and reproduction in any medium, provided the original work is properly cited.
