An International Journal
Agricultural and Biological Research
ISSN - 0970-1907
RNI # 24/103/2012-R1
RNI # 24/103/2012-R1
Research Article - (2024) Volume 40, Issue 2
The aim of this study was to investigate the fiber properties, pulp and paper-making potential of Eucalyptus globulus grown in Farta woreda, Amhara National Regional State, Ethiopia. Six trees with an age of eight years were sampled and sample discs were taken at the bottom (10%), middle (50%) and top (90%) along the tree height, as well as 2 × 2 × 2 cm blocks of wood at 10%, 50% and 90% of the disc radius (distance from the pith to the bark of the tree). Fiber properties were determined and their variation along tree height and transversally from pith to bark was evaluated. The overall mean values along the height of the tree and the distance from the pith to the bark were 0.77 mm for the fiber length, 12.38 µm for the fiber diameter, 2.94 µm for the cell wall thickness, 8.23 µm for the lumen diameter, 19.61 µm for the fiber width, 0.74% for the runkel ratio, 39.22% for the slenderness ratio, 67.83% for the flexibility coefficient and 0.47% for the wall coverage ratio. Fiber length, lumen and fiber diameter, fiber width, cell wall thickness, runkel and wall coverage ratio decreased from the bottom to the top of the tree, while they increased transversally from the pith to the bark, except for lumen diameter and flexibility coefficient, which decreased transversally from the pith to the bark, whereas the flexibility coefficient value increased from the bottom to the top of the tree height. The slenderness ratio did not show significant variation along tree height, while it showed an increase transversally from the pith to the bark.
Eucalyptus globulus; Disc radius; Fiber property; Paper; Tree age; Tree height
Anatomical variations in the cell structures result in variations in wood properties within and between trees [1]. These wood properties also depend on genetic variation, growth conditions and the environment [2]. Within a tree, differences are mostly between juvenile, heartwood and sapwood, variation within annual rings, reaction and normal wood [1]. The change in anatomical characteristics such as fiber length, fiber and lumen diameter, fiber width and cell wall thickness within and between trees has a strong effect on the properties of wood fiber products like pulp and paper. Pulp is a lignocellulose fibrous material manufactured from the mechanical or chemical breakdown of raw materials containing cellulose fibers, such as wood and non-wood materials. While paper is a felted sheet formed on a fine mesh from cellulose fibers, worldwide, cellulose pulp is produced from hardwood, softwood and agro-residues. Hardwood and softwood pulping account for 95% of the total worldwide pulp production. The rest of the 5% comes from non-wood raw materials, mainly agro-residues and grasses [3].
In the meantime, modern life requires consumption of paper and paper products every day; as a result, the demand for paper is increasing with the increasing size of the population and modernization. This ever-growing demand for pulp and paper products has forced countries around the world to look for potential and sustainable raw materials for the pulp and paper industries. Every year, 400 million metric tons of paper and cardboard are produced worldwide [4]. In Ethiopia in the year 2003, the average annual domestic production of paper was 7,266 tons, while in the same period, 127,132 tons of paper were imported, which means the average total supply of paper during the period under consideration was 134,398 tons per annum, of which only about 5% was locally produced [5]. The Food and Agriculture Organization’s report indicated that Ethiopia’s paper and paperboard production and consumption in 2012 were 78,000 and 142,000 MT respectively [6]. Complementary figures obtained from the Chemical and Construction Input Industry Development Institute indicated that Ethiopia imported more than 117,000 tons of paper and pulp in 2013, with the country spending more than 2.6 billion birr. The global consumption of paper and board amounted to an estimated 399 million metric tons in 2020. It is expected that demand will increase steadily over the next decade, reaching approximately 461 million metric tons in 2030 (Food and Agricultural Organization, 2012). As a result, there has been a huge need for industrial raw materials and technologies to manufacture more pulp and paper so as to fill the widening gap between demand and supply. With this understanding, the search and investigation of other alternative raw materials for pulp and paper production from wood and non-wood raw material sources is crucial. Because of its wider agro-ecological adaptability, fast growth, multiple coppicing abilities, adequate supply and high yield of good-quality fibers, Eucalyptus globulus is one of the raw materials widely used in the pulp and paper industry.
Eucalyptus globulus, commonly known as southern blue gum, is a species of tall, evergreen tree endemic to south-eastern Australia [7]. It is naturally distributed in Tasmania and south-eastern Australia but is now widely planted and naturalized in subtropical regions around the world. In tropical Africa, it is found in cool highland regions, especially in Ethiopia, where it was introduced around 1890. The introduction of E. globulus to Ethiopia is said to have played a major role in the development of the country and today, the tree is important all over the country for its various uses.
The wood of E. globulus is used for poles, posts, construction, veneer, plywood, flooring, furniture, tools, boxes, crates, pallets, railway sleepers, fiberboard and particleboard. It is also suitable for marine construction, ship and boat building, vehicle bodies, toys and novelties, turnery, interior trim, core stock, joinery and mine props. E. globulus is very important as fuel wood and for charcoal making and it is an important source of pulp for the production of printing, writing, specialty and tissue papers. Eucalyptus is the most common short-fiber source for pulpwood [8,9]. The fiber length of Eucalyptus is relatively short and uniform with low coarseness compared with other hardwoods commonly used as pulpwood; the low coarseness is important for high-quality coated papers and contributes to softness [8]. The fibers are thin but relatively thick-walled, resulting in uniform paper formation, a high number of fibers per gram and high opacity, all of which are important for all types of fine paper. Even though E. globulus has many uses and desirable properties, such as fast growth, coppicing ability, enough supply and adaptability to most parts of Ethiopia, the fiber properties and pulp and paper making potential of the species in the country have not been studied. Therefore, the objective of this study was to investigate the fiber properties, pulp and papermaking potential of Eucalyptus globulus growing in the south Gondar zone, Farta woreda, in Amhara National Regional State, Ethiopia.
Sample selection for the determination of fiber property
In this study, sample trees of Eucalyptus globulus from Amhara forest enterprise, south Gondar zone, Farta woreda, at the gasay site were collected. Farta woreda is located in the south Gondar administrative zone of the Amhara National Regional State, Ethiopia. It’s around 100 kilometers north of Bahir Dar, the regional capital city and 675 kilometers north of Addis Ababa. The study area has a latitude and longitude of 12°00’00.0” N and 38°00’00.0” E, with elevations ranging from 2600 to 3100 meters above sea level. The mean annual rain fall is 1250 mm and the minimum and maximum temperatures range from 9 to 25°C [10].
There were only eight-year-old trees on the site and they were spaced 1.5 meters apart. A 25-by-25-meter tree plot was then designated and demarcated. Then, measurements and records of each tree's diameter and merchantable tree height were made for every tree in the plot (Table 1). Six randomly selected sample trees were taken from the plot and transported to the Forest Products Innovation Center of Excellence's Wood Anatomy Laboratory for further investigation of the fiber properties of this species.
| No | Merchantable tree height of the sampled trees in meters (m) | Diameter at Breast Height (DBH) of the sampled tree in centimeters (cm) |
|---|---|---|
| 1 | 14.2 | 11 |
| 2 | 17.1 | 16 |
| 3 | 13.7 | 12.5 |
| 4 | 16.6 | 15 |
| 5 | 14 | 13 |
| 6 | 14.1 | 13 |
Table 1: The height and diameter of the sampled trees.
Sample preparation for the determination of fiber properties
Six trees were felled from the selected site and discs with a thickness of 25 mm were cut at the bottom (10%), middle (50%) and top (90%) of the tree height. Discs with visible reaction wood were excluded and regions close to knots were avoided for the fiber sampling. The discs were sanded and cleaned with a disc sander to improve the visibility of the samples. Then 2 cm × 2 cm × 2 cm samples of wood block were cut at 10% (near the pith), 50% (middle) and 90% (near the bark) of the disc radius (distance from the pith to the bark of the tree) for the determination of the fiber properties (Figure 1).

Figure 1: Sample technique for the determination of fiber properties.
Determination of fiber length and width
The fiber length and width were determined in all wood sections after maceration. Maceration is a technique used to separate fibers by dissolving the middle lamella. Match-stick-sized sections of wood were cut from the small blocks of wood (2 cm × 2 cm × 2 cm samples of wood block) and then macerated in jeffrey’s solution (10 g chromic acid dissolved in 190 ml distilled water, to which 15 ml nitric acid was added) at room temperature for 24 hours. The fibers were separated, washed in a glass tube and then cleaned and stored in distilled water. For a microscopic analysis, a few drops of the fiber suspension were spread on a microscopic slide and the water was allowed to evaporate (Figure 2a). Two slides were prepared per sample and from each slide, three images were acquired with a BA 210 stereomicroscope (Figure 2b). The image was 10 times magnified and the length and width of a hundred intact fibers were measured with Motic Image Software plus 3.2 to determine the average value per sample.

Figure 2: (a): Microscope slide preparation; (b): Images captured with a BA 210 stereo microscope.
Determination of cell wall thickness, fiber and lumen diameter
Cell wall thickness, fiber diameter and lumen diameter were measured on about 20 μm-thick cross-sections cut from each 2 cm × 2 cm × 2 cm block of wood. Before the sections were cut, the wood blocks were softened in warm water below 100°C for one hour and the sections were cut with a rotary microtome thereafter. The first three sections were discarded to avoid deforming cells in the sample. One image was acquired from each of the three sections with a BA 210 stereo microscope. The images were magnified 400 times and the cell wall thickness, fiber and lumen diameter of 100 cells per sample were measured to determine the average value per sample.
Determination of derived fiber properties
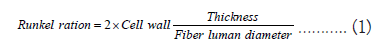
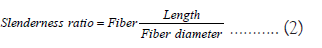
The equations used for the determination of derived fiber values are expressed as equations 1 to 4. Runkel ratio, slenderness ratio, flexibility coefficient and wall coverage ratio were the equations utilized to calculate the derived values [11-14].


Experimental design
Six trees were randomly selected from an even-aged, stand and sample discs were taken at the bottom (10%), middle (50%) and top (90%) along the tree height, as well as a 2 × 2 × 2 cm blocks of wood at 10% (near to pith), 50% (middle) and 90% (near to bark) of the disc radius (the transversal distance from the pith to the bark of the tree).
Statistical analysis
To determine significant effects at P<0.05, an Analysis of Variance (ANOVA) was used. The Statistical Package for the Social Sciences (SPSS) software was used to plot the graph and analyze the data.
Fiber properties
The mean and range of fiber properties along the tree height and transversally from the pith to the bark of the tree: The result showed that the overall mean values were 0.77 mm for fiber length, 12.38 μm for fiber diameter, 2.94 μm for cell wall thickness, 8.23 μm for lumen diameter and 19.61 μm for fiber width, along the tree height and transversally from pith to the bark of the tree (the disc radius). The fiber length, lumen diameter, cell wall thickness, fiber width and fiber diameter ranged from 0.52 to 1.07 mm, 5.46 to 8.60 μm, 1.50 to 4.84 μm, 14.89 to 26.77 μm and 8 to 17.39 μm, respectively, along with the tree height and distance from the pith to the bark of the tree.
Variation of fiber length along the tree height and distance from the pith to the bark of the tree: The results showed that a significant (p<0.05) variation in mean fiber length was found along the tree height and transversally from the pith to the bark. The mean fiber length decreased from the bottom to the top of the tree; however, it increased transversally from the pith to the bark of the tree (Table 2 and Figure 3).
| Fiber properties | N | Tree height (%) | Distance from the pith to the bark (%) | ||||
|---|---|---|---|---|---|---|---|
| Top | Middle | Bottom | 10% | 50% | 90% | ||
| FL (mm) | 18 | 0.68 ± 0.11a | 0.80 ± 0.17b | 0.82 ± 0.15b | 0.61 ± 0.68a | 0.80 ± 0.82b | 0.89 ± 0.15c |
| CWT (μm) | 18 | 2.38 ± 0.45a | 2.92 ± 0.55b | 3.51 ± 0.93c | 2.15 ± 0.31a | 3.12 ± 0.52b | 3.54 ± 0.77c |
| FD (μm) | 18 | 10.50 ± 1.76a | 12.98 ± 1.65b | 1 3.66 ± 1.10b | 10.83 ± 2.08a | 12.55 ± 1.5b | 13.76 ± 2.07c |
| LD (μm) | 18 | 7.19 ± 0.81a | 8.92 ± 1.32b | 8.57 ± 2.14b | 9.20 ± 2.34a | 7.91 ± 0.95b | 7.57 ± 0.90b |
| FW (μm) | 18 | 17.90 ± 2.3a | 20.55 ± 2.58b | 20.38 ± 1.86b | 18.17 ± 1.84a | 19.98 ± 1.82b | 20.68 ± 3.19b |
Note: FL: Fiber Length; CWT: Cell Wall Thickness; FD: Fiber Diameter; LD: Lumen Diameter; FW: Fiber Width. Mean of the same row with different superscript are significantly different at p<0.05.
Table 2: The mean and standard deviation values of fiber properties along with the tree height and distance from the pith to the bark of the tree.

Figure 3: Variation of mean fiber length along the tree height and distance from the pith to the bark of the tree; 
The bottom and middle sections of the tree had a significantly larger mean fiber length (0.82 ± 0.15 mm) and (0.80 ± 0.17 mm) than the top of the tree section (0.68 ± 0.11 mm); however, there was no significant (p<0.05) variation of mean fiber length between the bottom and middle sections of the tree. There was significant variation in the mean of fiber lengths between 10% (0.61 ± 0.68 mm), 50% (0.80 ± 0.82 mm) and 90% (0.89 ± 0.15 mm) of the disc radius. The smallest fiber length (0.52 mm) was found at the top of the tree section and 10% of the disc radius, whereas the longest fiber length (1.07 mm) was found at the bottom of the tree and 90% of the disc radius. Similar studies were conducted on E. globulus and the results showed an increase in fiber length from the pith to the bark of the tree, which was from 0.59 mm to 1.25 mm, 0.69 mm to 1.18 mm, 0.74 mm to 1.09 mm and 0.63 mm to 1.03 mm, respectively [15-18]. Mohd. Hamami et al., [19] also found the same axial variation in Acacia mangium with a decrease in fiber length along the height, which was 1.03 mm to 0.85 mm. The reason for this trend was attributed to the influence of cambial age on the development and maturation of fiber from pith to bark [20].
Variation of cell wall thickness along the tree height and distance from the pith to the bark of the tree: The results showed that there was a significant (p<0.05) variation in cell wall thickness between the top, middle and bottom of the tree section and between 10%, 50% and 90% of the disc radius. The mean cell wall thickness decreased from the bottom (3.51 ± 0.93) to the top (2.38 ± 0.45) of the tree, while it showed increases transversally from the pith (2.15 ± 0.31 μm) to the bark (3.54 ± 0.77 μm) (Table 2 and Figure 4). The thinnest fiber wall (1.50 μm) was found at the top of the tree and 10% of the disc radius, whereas the thickest fiber wall (4.84 μm) was found at the bottom of the tree and 90% of the disc radius. The average cell wall thickness in this study was 2.94 m. This result is similar to the studies reported on Eucalyptus globulus [16,17,21]. They found that the thickness of the cell wall was between 1.8 and 2.3 μm, 1.79 and 3.06 μm and 3.52 and 3.27 μm along the tree height. Similar studies on the same species revealed an increase in wall thickness (from 1.8 μm to 2.5 μm) transversally from pith to bark.

Figure 4: Variation of mean cell wall thickness along the tree height and distance from the pith to the bark of the tree; 
Variation of lumen diameter along the tree height and distance from the pith to the bark of the tree: Table 2 shows that there was a substantial (p<0.05) variation in lumen diameter along the height of the trees and transversally from the pith to the bark. There was no significant difference in lumen diameter between the middle and bottom sections of the tree (Table 2 and Figure 5), but the bottom (8.57 ± 2.14 μm) and middle (8.92 ± 1.32 μm) of the tree sections had significantly (p>0.05) larger mean lumen diameters than the top (7.19 ± 0.81 μm) of the tree section. In the bottom and middle parts of the tree, there was a decrease in the mean lumen diameter from 9.20 ± 2.34 μm to 7.57 ± 0.90 μm; however, at the top of the tree, there was an increase in lumen diameter transversally from pith to bark (Figure 5). No significant variation in the mean lumen diameter was found between 50% (7.91 ± 0.95 μm) and 90% (7.57 ± 0.90 μm) of the disc radius in all the tree sections. While the two sections (50% and 90%) had significantly smaller lumen diameters than 10% (9.20 ± 2.34 μm) of the disc radius, the smallest lumen diameter (5.46 μm) was found at the bottom of the tree and 90% of the disc radius, whereas the largest lumen diameter (12.45 μm) was found at the bottom of the tree and 10% of the disc radius. The average lumen diameter found in this study was 8.23 μm, which is in line with E. globulus stem wood reported which was 4 to 9.5 μm for lumen diameter [22-26].

Figure 5: Variation of mean lumen diameter along the tree height and distance from the pith to the bark of the tree; 
Variation of fiber diameter along the tree height and distance from the pith to the bark of the tree: Fiber diameter has shown a significant (p<0.05) variation along the tree height and transversally from the pith to the bark of the tree (Table 2 and Figure 6). The results showed a decrease in the mean fiber diameter along the height from the bottom (13.66 ± 1.10 μm) to the top (10.50 ± 1.76 μm) of the tree. The bottom (13.66 ± 1.10 μm) and middle (12.98 ± 1.65 μm) of the tree section showed significantly (p<0.05) higher mean fiber diameter than the top (10.50 ± 1.76) of the tree section; however, no significant (p<0.05) variation in the mean fiber diameter was observed between the middle and bottom sections of the trees. On the other hand, a significant increase in the mean fiber diameter was observed between 10%, 50% and 90% of the disc radius, with mean values of 10.83 ± 2.08 μm, 12.55 ± 1.5 μm and 13.76 ± 2.07 μm. The smallest fiber diameter (8 μm) was found at the top of the tree and 10% of the disc radius, whereas the largest fiber diameter (17.39 μm) was found at the bottom of the tree and 90% of the disc radius. The mean fiber diameter of E. globulus examined in this study was 12.38 μm; a similar 12 to 21.3 μm mean value was reported on E. globulus stem wood [22-26].

Figure 6: Variation of mean fiber diameter along the tree height and distance from the pith to the bark of the tree; 
Variation of fiber width along the tree height and distance from the pith to the bark of the tree: Fiber width showed a significant (p<0.05) variation along the tree height and distance from the pith to the bark of the tree (Table 2). It showed a decrease in the mean fiber width from the bottom to the top of the tree in all the tree sections. The fiber width at the bottom (20.38 ± 1.86) and middle (20.55 ± 2.58) of the tree section varied significantly (p<0.05) from the top (17.90 ± 2.3) of the tree section. It showed a decrease in the mean fiber width from the bottom to the top of the tree section, while no significant (p<0.05) change in the mean fiber width was observed between the middle and bottom sections of the tree. All of the tree sections that were found at 50% and 90% of the disc radius showed a significant (p<0.05) variation in the mean fiber width compared to those found at 10% of the disc radius. It showed an increase in the mean of fiber width from 10% (18.17 ± 1.84) to 90% (20.68 ± 3.19) of the disc radius; however, there was no significant (p<0.05) variation in the mean of fiber width between 50% (19.98 ± 1.82) and 90% (20.68 ± 3.19) of the disc radius (Table 2 and Figure 7). The smallest fiber width (14.89 μm) was found at the top of the tree and 10% of the disc radius, whereas the largest fiber width (26.77 μm) was found at the middle of the tree and 90% of the disc radius.

Figure 7: Variation of mean fiber width along the tree height and distance from the pith to the bark of the tree; 
Derived fiber properties
The mean and range of derived fiber properties along the tree height and transversally from the pith to the bark of the tree: The result showed that the overall mean values of derived fiber properties were 0.74 for runkel ratio, 39.22 for slenderness ratio, 67.83% for flexibility coefficient and 0.47 for wall coverage ratio. The fiber runkel ratio, slenderness ratio, flexibility coefficient and wall coverage ratio values ranged from 0.35 to 1.51, 27.14 to 68.85, 39.94% to 95.0% and 0.30 to 0.6, respectively, along with the tree height and transversally from the pith to the bark of the tree.
Variation of runkel ratio along the tree height and distance from the pith to the bark of the tree: The runkel ratio is related to the suitability of paper making and fibers with a runkel ratio of less than 1.0 are suitable for pulp [27]. Fibers with a higher runkel ratio are stiffer and form bulkier paper with a lower bonded area when compared to low runkel ratio fibers [28]. A lower runkel ratio indicates that the fibers collapse easily to form paper with good strength properties [29]. The results of this study showed that there was a significant (p<0.05) variation of runkel ratio values along the tree height and transversally from the pith to the bark of the tree (Table 3 and Figure 8). The mean values of the runkel ratio showed decreases from the bottom (0.90 ± 0.38) to the top (0.66 ± 0.083) of the tree. However, there was no significant (p<0.05) variation in average runkel ratio values between the middle (0.68 ± 0.21) and the top (0.66 ± 0.083) sections of the tree. However, there was a notable difference in the mean runkel ratio values between 10%, 50% and 90% of the disc radius, with values of 0.49 ± 0.10, 0.80 ± 0.16 and 0.96 ± 0.28 respectively. The minimum runkel ratio value (0.34) was found at the middle of the tree section and 10% of the disc radius, whereas the maximum rankle ratio value (1.51) was found at the bottom of the tree section and 90% of the disc radius.
| Derived fiber properties | N | Tree height (%) | Distance from the pith to the bark of the tree (%) | ||||
|---|---|---|---|---|---|---|---|
| Top | Middle | Bottom | 10% | 50% | 90% | ||
| Runkel ratio | 18 | 0.66 ± 0.083a | 0.68 ± 0.21a | 0.90 ± 0.38b | 0.49 ± 0.10a | 0.80 ± 0.16b | 0.96 ± 0.28c |
| Slenderness | 18 | 38.24 ± 4.99a | 39.32 ± 9.71a | 40.09 ± 6.15a | 33.76 ± 4.48a | 40.35 ± 4.46b | 43.55 ± 8.14b |
| Flexibility | 18 | 69.37 ± 6.71a | 70.28 ± 15.80a | 63.83 ± 18.00b | 83.96 ± 7.2a | 63.38 ± 6.7b | 56.15 ± 10.2c |
| Wall coverage ratio | 18 | 0.45 ± 0.48a | 0.45 ± 0.59a | 0.52 ± 0.13b | 0.40 ± 0.55a | 0.50 ± 0.06b | 0.52 ± 0.10b |
Note: Mean of the same row with different superscript are significantly different at p<0.05.
Table 3: The mean and standard deviation values of derived fiber properties along with the tree height and distance from the pith to the bark of the tree.

Figure 8: Variation of mean runkel ratio along the tree height and distance from the pith to the bark of the tree; 
On the other hand, a significant variation in runkel ratio values was found between 10%, 50% and 90% of the disc radius, with mean runkel ratio values of 0.49 ± 0.10, 0.80 ± 0.16 and 0.96 ± 0.28 respectively. The minimum runkel ratio value (0.34) was found at the middle of the tree section and 10% of the disc radius, whereas the maximum rankle ratio value (1.51) was found at the bottom of the tree section and 90% of the disc radius.
For E. globulus trees 14 years of age, the Ohshima et al., [30] values ranged from 0.54 to 0.6 and the Gominho et al., [31] values, which were reported on E. globulus stump wood intended as a raw material for pulping, varied between 1.0 and 1.9, with a mean value of 1.4. The mean runkel ratio values of E. globulus examined in this study were 0.74. These values differed slightly from them. The findings indicated that the runkel ratio values of the species were within the standard range for pulp and papermaking.
Variation of slenderness ratio along the tree height and distance from the pith to the bark of the tree: The slenderness ratio is related to the tearing strength and folding endurance of paper; a high ratio indicates better-formed and well-bonded paper [28,32,33]. The results of this study showed that there was a significant (p<0.05) variation in slenderness ratio values transversally from the pith to the bark. Greater mean slenderness ratio values were seen over the disc radius from 10% (33.7 ± 6.48) to 90% (43.55 ± 8.14); however, there was no statistically significant (p<0.05) difference between 50% (40.35 ± 4.46) and 90% (43.55 ± 8.14). Slenderness ratio values did not show significant (p<0.05) variation along the tree height, while they showed a decreasing trend from the bottom to the top of the tree (Table 3 and Figure 9). The minimum values of slenderness ratio (27.14) were found at the top of the tree and 90% of the disc radius, whereas the maximum values of slenderness ratio (68.85) were found in the middle of the tree and 90% of the disc radius. Previously, Pirralho et al., [34] reported values for the slenderness ratio ranging from 39.4 to 48.4 for several Eucalyptus species; Ohshima et al., [30] also reported a ratio of 50.5 to 56.5 and 57.7 to 59.9 for 14-year-old E. camaldulensis and E. globulus, respectively. The mean slenderness values of E. globulus examined in this study were 39.22, which is similar to or slightly lower than those reported by Pirralho et al., [34] and Ohshima et al., [30]. However, the accepted values of slenderness coefficients in the pulp and paper industry are more than 33. Based on accepted standards, the fiber properties of E. globulus woods, which were revealed in this study, are suitable for pulp and paper production.

Figure 9: Variation of mean slenderness ratio along the tree height and distance from the pith to the bark of the tree; 
Variation of the flexibility coefficient along the tree height and distance from the pith to the bark of the tree: According to Ashori and Nourbakhsh [28], it is reported that the flexibility coefficient expresses the potential of the fiber to collapse during beating or during drying of the paper web. The collapsed fibers then provide a greater bonding area and, therefore, a stronger paper. In addition, Moriya [35] reported that the flexibility coefficient was positively related to paper strength, such as burst and tear factors. There are four groups that are established according to the flexibility ratio: high elastic fiber (having a flexibility ratio greater than 75), elastic fiber (flexibility ratio between 50 and 75) and rigid fiber (flexibility ratio between 30 and 50) and high rigid fibers (flexibility ratio less than 30) [36]. The study’s findings showed that the mean flexibility coefficient values varied significantly (p<0.05) along the tree’s height and across its pith to bark (Table 3 and Figure 10). There was no significant (p<0.05) variation in the mean flexibility coefficient values between the middle (70.28 ± 15.80) and top (69.37 ± 6.71) sections of the tree, but there were significant increases in the mean values from the bottom (63.83 ± 18.00) to the top (69.37 ± 6.71) of the tree. There were significant (p<0.05) changes in the mean flexibility coefficient values across 10%, 50% and 90% of the disc radius, with mean values of 83.96 ± 7.2, 63.38 ± 6.7 and 56.15 ± 10 respectively. A decrease in the mean flexibility coefficient values was shown transversally from 10% to 90% of the disc radius (the distance from the pith to the bark). The smallest flexibility coefficient values (39.94) were found at the bottom of the tree and 90% of the disc radius, whereas the largest flexibility coefficient values (95.00) were found at the middle of the tree and 10% of the disc radius. The reported values for the flexibility coefficient ranged from 37 to 65 in several Eucalyptus species and were 70 and 72 in E. camaldulensis and E. globulus, respectively [34,37]. The mean flexibility coefficient values of E. globulus examined in this study were 67.83 and this result is similar to the values reported by Pirralho et al., [34] and Ona et al., [37]. Therefore, the E. globulus fibers investigated in this study belong to the elastic fiber groups. Based on this finding, the fiber properties of the studied species are suitable for the pulp and paper industry to produce quality paper.

Figure 10: Variation of mean flexibility coefficient along the tree height and distance from the pith to the bark of the tree; 
Variation of wall coverage ratio along the tree height and transversally from the pith to the bark of the tree: The wall coverage ratio is an index for bending resistance and is related to fiber flexibility [14,38]. A material with a wall coverage ratio value less than 0.4 is considered to be good pulpwood [39]. The present study showed that there was a significant (p<0.05) variation in wall coverage ratio values along the tree height and transversally from pith to bark. A significant (p<0.05) decrease in the mean wall coverage ratio values was shown from the bottom (0.52 ± 0.13) to the top (0.45 ± 0.48) of the tree. On the other hand, no significant (p<0.05) change in the mean value of the wall coverage ratio was observed between the middle (0.45 ± 0.59) and top (0.45 ± 0.48) sections of the tree (Table 3 and Figure 11).

Figure 11: Variation of mean wall coverage ratio values along the tree height and distance from the pith to the bark of the tree; 
Mean wall coverage ratio values increased transversally from 10% to 90% of the disc radius. There was a significant (p<0.05) difference in the mean wall coverage ratio values for 50% (0.50 ± 0.06) and 90% (0.52 ± 0.10) of the disc radius compared to those for 10% of the disc radius (0.40 ± 0.55). However, no significant (p<0.05) change was observed in the mean value of the wall coverage ratio between 50% and 90% of the disc radius (Table 3 and Figure 11). The smallest value of wall coverage ratio (0.30) was found at the bottom of the tree and 10% of the disc radius, whereas the largest values of wall coverage ratio (0.76) were found at the bottom of the tree and 90% of the disc radius. The results of this study also presented a mean wall coverage ratio value of 0.47, which is slightly above the recommended values.
Significant variations in fiber properties were found along the height and in transversal sections across the stems of the investigated Eucalyptus globulus trees. Fiber length, lumen and fiber diameter, fiber width, cell wall thickness, runkel and wall coverage ratio decreased from the bottom to the top of the tree, while they increased transversally from the pith to the bark of the tree, except lumen diameter and flexibility coefficient, which decreased from the pith to the bark of the tree. The flexibility coefficient value increased from the bottom to the top of the tree, while the slenderness ratio also increased transversally from the pith to the bark. However, no significant variation in slenderness ratio was found along the tree’s height.
The overall result indicated that, at eight years of age, Eucalyptus globulus grown in Farta woreda at gasay possessed all of the accepted fiber qualities needed to make pulp and paper. With these properties, Eucalyptus globulus can be used as a potential raw material for quality pulp and paper production in the studied areas. The following research areas are recommended for future study:
1) Further research should be carried out in different agro-ecologies in Ethiopia to obtain a comprehensive understanding of the fiber properties of the species.
2) The fiber properties of this species should be investigated for different types of tree management and spacing.
3) Aside from the information on the properties of the fibers revealed in this study, the production and testing of pulp and paper made from them should be carried out.
The authors owe gratitude to Ethiopian forest development for covering the expense of the research and the Forest Products Innovation Center of Excellence for providing laboratory facilities and enormous assistance in advancing the study.
Daniel Gebeyehu, the first and corresponding author of the paper, idea generation, methodology, experimentation, data organization, data analysis, first draft writing, reviewing and editing; Lamesa Abara, the co-author, provided guidance, wrote, reviewed and edited the paper; Degnechew Genene, the co-author, supervised, reviewed and edited the paper. The corresponding author and co-authors have finally organized, reviewed and approved the manuscript.
On behalf of all authors, the corresponding author states that there is no conflict of interest in the publication or authorship of the paper.
Citation: Gebeyehu D, Abara L. Evaluation of fiber properties of Eucalyptus globulus grown in Farta woreda as a potential source for pulp and paper making, Amhara national regional state, Ethiopia. AGBIR.2024;40(2):933-941.
Received: 26-Jan-2024, Manuscript No. AGBIR-24-126077; , Pre QC No. AGBIR-24-126077 (PQ); Editor assigned: 29-Jan-2024, Pre QC No. AGBIR-24-126077 (PQ); Reviewed: 12-Feb-2024, QC No. AGBIR-24-126077; Revised: 19-Feb-2024, Manuscript No. AGBIR-24-126077 (R); Published: 26-Feb-2024, DOI: 10.35248/0970-1907.24.40.933-941
Copyright: This open-access article is distributed under the terms of the Creative Commons Attribution Non-Commercial License (CC BY-NC) (http:// creativecommons.org/licenses/by-nc/4.0/), which permits reuse, distribution and reproduction of the article, provided that the original work is properly cited and the reuse is restricted to noncommercial purposes. For commercial reuse, contact reprints@pulsus.com This is an open access article distributed under the terms of the Creative Commons Attribution License, which permits unrestricted use, distribution, and reproduction in any medium, provided the original work is properly cited.


