An International Journal
Agricultural and Biological Research
ISSN - 0970-1907
RNI # 24/103/2012-R1
RNI # 24/103/2012-R1
Research Article - (2024) Volume 40, Issue 2
Wheat is a self-pollinating annual plant, is extensively grown for staple food in the world. Yellow and stem rust of wheat are the most important fungal diseases of wheat and the major production challenges in the major wheat producing regions of Ethiopia. The present research was conducted at Kulumsa for yellow rust and Dera for stem rust in 2021 with the objective to evaluate bread wheat genotypes for yellow and stem rust adult plant resistance and to assess the diseases impact on grain yield in the natural field condition. Based on final rust severity for yellow and stem rust severity showed from immune 0 to 90%, for yellow rust 51 genotypes showed high adult plant resistance (1-20% of severity), 4 genotypes observed as medium adult plant resistance (21-40% of severity) and 9 genotypes observed as low adult plant resistance (>41% of yellow rust severity), for stem rust 44 genotypes showed high adult plant resistance (1-20 % of severity), 8 genotypes observed as medium adult plant resistance (21-40 % of severity) and 12 genotypes observed as low adult plant resistance (>41% of stem rust severity). Tested genotypes showed diverse reactions for yellow and stem rust ranging from Resistance (R) to Susceptible (S) responses. The regression analysis showed that when the yellow rust severity changes within a unit the grain yield decreased by 35.871 kg/ha and when the stem rust severity changes within a unit the grain yield decreased by 18.574 kg/ha. The correlation analysis also revealed that grain yield had negative significant correlation with yellow rust (r=-0.78) and stem (r=-0.67) disease severity and Area Under the Disease Progress Curve (AUDPC). Genotypes 2 and 46 had maximum grain yield 6.07 t/ha and 5.67 t/ha with low yellow rust AUDPC value 35 and 0 respectively. Genotypes 30 and 4 had maximum grain yield 3.94 t/ha and 3.85 t/ha with low stem rust AUDPC value 0 and 21 respectively.
Adult plant resistance; AUDPC; Grain yield; Stem rust; Yellow rust; Triticum aestivum
Wheat (Triticum aestivum L.) is a self-pollinating annual plant, the grass family Gramineae, is extensively grown for staple food in the world [1,2]. It is the second important food crop next to rice at the global level [3]. It provides 20% of the calories and protein and feeding about 40% of the world population [4,5]. The world wheat production reaches about 775.1 and 778.0 million tonnes in 2020 and 2021 and it is estimated to be 794.6 million tonnes by 2022 respectively [6]. Wheat is not only the most important food security crop but also it is currently becoming strategic as a cash crop at the global level [7,8].
Ethiopia is primary largest wheat producer country in Africa [9,10]. Wheat ranks second next to maize in terms of yield production (5.78 million tons) and third in terms of area coverage (1.90 million hectares) following tef and maize among cereals for rain fed production in Ethiopia [11]. Wheat production in Ethiopia for 2021/22 is projected to 5.18 million tons, up by 1.6 percent over the 2020/21 production estimated. This is due to more Government of Ethiopia engagement in irrigation, better input supply and mechanized farming in the lowland and central parts of the country [12]. However, wheat production and productivity is relatively small compare to global standards. The main reason is that mostly subsistence farming of wheat is produced by small-scale farmers through rain feed production system with less irrigated production and constrained by several infectious diseases including rusts (yellow rust, stem rust and leaf rust) and septoria leaf blotch diseases which are the major problem of wheat production in Ethiopia [7,13-15].
Yellow and stem rust of wheat are the most important fungal diseases of wheat and the major production challenges in the major wheat producing regions of Ethiopia. Wheat yellow rust disease caused by Puccinia striiformis f. sp. tritici is one of the most threat and wheat production problem in the highland areas of Ethiopia [16]. Stem rust caused by Puccinia graminis f. sp. tritici, is the most destructive disease to wheat. Under favorable conditions, stem rust may cause yield losses up to 100 % to the susceptible varieties [17]. Ayele et al., [15] reported 22.9 % to 96.7% grain yield loss caused by yellow rust for bread wheat variety wane and kubsa respectively.
The solution for the yield loss by yellow and stem rust diseases are develop resistance bread wheat variety or appropriate use of fungicide chemicals. But develop the resistance variety is the best mechanism to control the rusts. Resistance to wheat rusts is generally categorized into two types, race-specific and race non-specific. Race-specific resistance is generally qualitative and usually short-lived due to the evolution of potentially virulent pathogens [17]. In contrast, adequate levels of race non-specific resistance involve genes which might contribute from minor to intermediate effects. Plants carrying this type of resistance are susceptible at the seedling stage but express resistance at the post-seedling stages of plant growth. This characteristic is called slow rusting and often associated with some forms of Adult Plant Resistance (APR) [18]. Hence, the present study designed to evaluate bread wheat genotypes for yellow and stem rust adult plant resistance and to assess the diseases impact on grain yield in the natural field condition.
Experimental site and year
The research was conducted at two locations, Kulumsa and Dera in 2022 main cropping season. Kulumsa is located at 08°01'10"N longitude and 39°09'11"E latitude at an altitude of 2200 meters above sea level. The mean annual rain fall of Kulumsa is 820 mm with an average annual temperature of 16.5°C. Dera is located 8°19'10"N longitude and 9°19'13"E latitude at an altitude of 1650 meters above sea level. The mean annual rain fall of the site is 680 mm with an average annual temperature of 20.9°C.
Experimental materials and design
The materials consisted of 64 bread wheat genotypes and arranged in 8 × 8 simple lattice design. The materials were introduced from International Maize and Wheat Improvement Center (CIMMYT) and International Center for Agricultural Research in Dry Areas (ICARDA) and entries and pedigrees of the genotypes.
Yield data
Yield data was collected on the net plot of 3 m2 and adjusted by moisture content and converted to kilogram per hectare.
Disease scoring
To evaluate these genotypes for yellow and stem rust diseases have been planted at two locations, Kulumsa for yellow rust and Dera for stem rust. Disease scoring was made four times at both locations Kulumsa and Dera at fourteen day’s interval, recording started by assessing plots and observed spore on leaves surfaces of some susceptible genotypes up to the disease development and the crop response to the disease stop/at maturity stage. Host response to both rusts was recorded based on the modified Cobb scale [19]. This scale combines several infection types; Resistant (R), Moderately Resistant (MR), Moderately Susceptible (MS), Moderately Resistant to Moderately Susceptible (MRMS) and Susceptible (S). Severity was recorded on 0-100% scale where 0% was considered as immunity while 100% was completely susceptible.
Coefficient of infection
Coefficient of Infection (CI) was calculated by using data on disease severity and host reaction by multiplying the severity value by the arbitrary constant value for field response [16,20], where R=0.2, MR=0.4, M=0.6, MS=0.8 and S=1 and used to classify genotypes in to three groups based on disease severity such as 1-20 high adult plat resistance, 21-40 intermediate and 41- 100 low adult plant resistance [21]. The Area Under Disease Progress Curve (AUDPC) value was calculated as
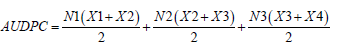
Where, X1, X2, X3 and X4 are rust intensities recorded on first, second, third and fourth recording date and N1 is interval day between X1 and X2, N2 is interval day between X2 and X3, N3 is interval day between X3 and X4.
Relationships between the amount of disease severity and yield loss is expressed in the form of linear regression equations where the independent variable is disease severity (X) at the end stage and the grain yield (Y) is the dependent variable. Linear regression was calculated by Snedecor et al., [22]. A linear regression has an equation of
Y = a + bX
Where, X is the independent variable (disease in the case of present study) and Y is the dependent variable (yield in the case of present study). The slope of the line is b and a is the intercept.
Final rust severity and response
The final rust severity for yellow rust severity showed from immune 0 to 90%. Based on final rust severity, for yellow rust 51 genotypes (79.69% of the studied genotypes) showed high adult plant resistance (1-20% of severity), 4 genotypes (6.25% of studied genotypes) observed as medium adult plant resistance (21-40% of severity) and 9 genotypes (14.06% of studied genotypes) observed as low adult plant resistance (>41% of yellow rust severity) (Figure 1). The result line up with Pathan et al., [21] who categorized the level of adult plant resistance such as high, medium and low APR based on their severity percentage.

Figure 1: Number and Adult Plant Resistance (APR) levels of tested genotypes for yellow rust severity.
Tested genotypes showed diverse reactions for yellow rust ranging from Immune (0) to Susceptible (S) responses. 5 genotypes (7.81% of the studied genotypes) were observed Immune (0), Resistant (R) and Moderately Resistant to Moderately Susceptible (MRMS) for each reaction types. 15 genotypes (23.44 % of the studied genotypes) were displayed Moderately Resistance (MR) reaction, 21 genotypes (32.81% of the studied genotypes) were showed Moderately Susceptible (MS) reaction and 13 genotypes (20.31% of the studied genotypes) were observed Susceptible (S) reactions for yellow rust response (Figure 2). Similar work also done by different researchers such as Ayele et al., [15], Bayisa et al., [23], Shewaye et al., [24] and Mohammadi et al., [25] who reported a range of severity and reactions of yellow rust disease observed on bread wheat genotypes.

Figure 2: Number of genotypes and reactions for yellow rust.
The final rust severity for stem rust severity showed from immune 0 to 90 %. Based on final rust severity percentage, for stem rust 44 genotypes (68.75% of the studied genotypes) showed high adult plant resistance (1-20% of severity), 8 genotypes (12.5% of studied genotypes) observed as medium adult plant resistance (21-40% of severity) and 12 genotypes (18.75% of studied genotypes) observed as low adult plant resistance (>41% of stem rust severity) (Figure 1). The result line up with Pathan et al., [21] who categorized the level of adult plant resistance such as high, medium and low APR based on their severity percentage.
Tested genotypes showed diverse reactions for stem rust ranging from Immune (0) to Susceptible (S) responses. 4 genotypes (6.25 % of the studied genotypes) were observed Immune (0), 6 genotypes (9.38% of the studied genotypes) were observed Resistant (R), 13 genotypes (20.31% of the studied genotypes) were observed Moderately Resistant (MR), 3 genotypes (4.69% of the studied genotypes) were observed Moderately Resistant to Moderately Susceptible (MRMS), 18 genotypes (28.13% of the studied genotypes) were displayed Moderately Susceptible (MS) reaction, 20 genotypes (31.25% of the studied genotypes) were showed Susceptible (S) reactions for stem rust disease response (Figure 2). Similar work also done by different researchers such as Shewaye et al., [24] and Shiferaw et al., [26] who reported a range of severity and reactions of stem rust disease observed on bread wheat genotypes (Figures 3 and 4).

Figure 3: Number and Adult Plant Resistance (APR) levels of tested genotypes for stem rust.

Figure 4: Number of genotypes and reactions for stem rust severity.
Disease and grain yield relationship
The result of analysis of variance by regression analysis for yellow rust revealed that yellow rust severity had highly significant at (P ≤ 0.01) effect on grain yield of tested bread wheat genotypes (Table 1). The regression analysis result for yellow rust that multiple R was 0.78 which is equal to the correlation coefficient between grain yield and yellow rust except direction, which shows strong linear relationship between grain yield and yellow rust severity. Coefficient of determination (R Square) was equal to 0.62 which means 62% variance of the grain yield can be accounted for by the yellow rust severity. And other 38 % of variance was hiding by other confounding factors (Table 2). Similar results reported by Sharma-Poudyal et al., [27] and Shiferaw et al., [26].
| df | SS | MS | F | Significance F | |
|---|---|---|---|---|---|
| Regression | 1 | 55332045 | 55332045 | 98.28333 | 2.08E-14 |
| Residual | 62 | 34905074 | 562985.1 | - | - |
| Total | 63 | 90237119 | - | - | - |
Note: df: degree of freedom; SS: Sum of Square; MS: Mean Square; F: Tabulated and calculated
Table 1: Analysis of Variance (ANOVA) for yellow rust by regression analysis.
| Regression statistics | |
|---|---|
| Multiple R | 0.78 |
| R square | 0.62 |
| Adjusted R square | 0.61 |
| Standard error | 750.32 |
| Observations | 64 |
Table 2: Regression statistics for yellow rust.
The regression analysis result showed that when the yellow rust disease severity increased by 0.78 the grain yield of the studied bread wheat genotypes decreased by 0.78 (Table 2 and Figure 5) and on the other hand when the yellow rust severity changes within a unit the grain yield of the studied bread wheat genotypes decreased by 35.871 kg/ha (Figure 6). The correlation analysis result also revealed that grain yield had negative significant (r=-0.78) correlation with yellow rust disease severity (Table 3). Similar result reported by Ayele et al., [15], Shiferaw et al., [26] and Shewaye et al., [24].

Figure 5: Association between grain yield and yellow rust severity;  .
.

Figure 6: Grain yield vs. yellow rust severity line fit plot by regression analysis;  .
.
| GY kg/ha | Yellow rust severity | |
|---|---|---|
| GY kg/ha | 1 | -0.78 |
| Yellow rust severity | -0.78 | 1 |
Note: GY kg/ha: Grain Yield in kilogram per hectare
Table 3: Correlation between grain yield and yellow rust severity.
The blue line graph represented grain yield and the red line graph represented AUDPC of yellow rust (Figure 7). The value of AUDPC of yellow rust had from 0 to 2380, genotypes such as 57, 58 and 36 had the maximum AUDPC of yellow rust 2380, 2310 and 2275 respectively, but the grain yield of these genotypes were low, 1.03 t/ha, 0.97 t/ha and 1.13 t/ha respectively. Whereas, genotypes 2 and 46 had maximum grain yield 6.07 t/ha and 5.67 t/ha with AUDPC value 35 and 0 respectively. Such like relationship was the same for all the studied genotypes grain yield and AUDPC of yellow rust, this indicated that grain yield and AUDPC of yellow rust shown negative association presented in line graph below in Figure 7. Similar result reported by Aktas et al., [28], Bayisa et al., [23], Shiferaw et al., [26] and Shewaye et al., [24] who reported that grain yield and yellow rust disease AUDPC shown negative association.

Figure 7: Association between grain yield in tone per hectare and Area Under
Disease Progress Curve (AUDPC) of yellow rust; 
 .
.
The result of analysis of variance by regression analysis for stem rust revealed that stem rust severity had highly significant at (P ≤ 0.01) effect on grain yield of tested bread wheat genotypes (Table 4). The regression analysis result for stem rust that multiple R was 0.67 which is equal to the correlation coefficient between grain yield and stem rust except direction, which shown strong the linear relationship between grain yield and stem rust severity. Coefficient of determination (R Square) was equal to 0.44 which means 44% variance of the grain yield can be accounted for by the stem rust severity. And other 56 % of variance was hiding by other confounding factors (Table 5). Similar results reported by Sharma-Poudyal et al., [27] and Shiferaw et al., [26].
| Source of var. | df | SS | MS | F | Significance F |
|---|---|---|---|---|---|
| Regression | 1 | 13573980 | 13573980 | 49.36 | 1.94E-09 |
| Residual | 62 | 17051693 | 275027.3 | - | - |
| Total | 63 | 30625672 | - | - | - |
Note: df: degree of freedom; SS: Sum of Square; MS: Mean Square; F: Tabulated and calculated.
Table 4: Analysis of Variance (ANOVA) for stem rust.
| Regression statistics | |
|---|---|
| Multiple R | 0.67 |
| R square | 0.44 |
| Adjusted R square | 0.43 |
| Standard error | 524.43 |
| Observations | 64 |
Table 5: Regression statistics for stem rust.
The regression analysis result showed that when the stem rust disease severity increased by 0.67 the grain yield of the studied bread wheat genotypes decreased by 0.67 (Table 5 and Figure 8) and on the other hand when the stem rust severity changes within a unit the grain yield of the studied bread wheat genotypes decreased by 18.574 kg/ha (Figure 9). The correlation analysis result also revealed that grain yield had negative significant (r=-0.67) correlation with stem rust disease severity (Table 6). Similar result reported by Shewaye et al., [24], Shiferaw et al., [26] who reported that grain yield and stem rust disease severity had negative association.

Figure 8: Association between grain yield and yellow rust severity;  .
.

Figure 9: Grain yield vs. stem rust severity line fit plot by regression analysis;  .
.
| GY kg/ha | Stem rust severity | |
|---|---|---|
| GY kg/ha | 1 | -0.67 |
| Stem rust severity | -0.67 | 1 |
Note: GY kg/ha: Grain Yield in kilogram per hectare.
Table 6: Correlation b/n grain yield and stem rust severity
The blue line graph represented grain yield and the red line graph represented AUDPC of stem rust (Figure 10), the value of AUDPC of stem rust had from 0 to 2310, genotypes such as 40, 6 and 57 had the maximum AUDPC of stem rust 2310, 2240 and 2100 respectively, however the grain yield of these genotypes were low, 1.7 t/ha, 1.28 t/ha and 1.74 t/ha respectively. On the other hand, genotypes 30 and 4 had maximum grain yield 3.94 t/ha and 3.85 t/ha with low AUDPC value 0 and 21 respectively. Such like relationship was the same for all the studied genotypes grain yield and AUDPC of stem rust, this indicated that grain yield and AUDPC of stem rust shown negative association presented in line graph below in Figure 10. The present result aligned with Shewaye et al., [24], Shiferaw et al., [26] who reported that grain yield and stem rust disease AUDPC had negative association.

Figure 10: Association between grain yield in tone per hectare and stem rust
Area Under Disease Progress Curve (AUDPC);  : AUDPC.
Wheat is a self-pollinating annual plant, is extensively grown for staple food in the world. Yellow and stem rust of wheat are the most important fungal diseases of wheat and the major production challenges in the major wheat producing regions of Ethiopia. The present research was conducted at Kulumsa for yellow rust and Dera for stem rust in 2022 with the objective to evaluate bread wheat genotypes for yellow and stem rust adult plant resistance and to assess the diseases impact on grain yield in the natural field condition.
Based on final rust severity for yellow and stem rust severity showed from immune 0 to 90 %, for yellow rust 51 genotypes showed high adult plant resistance (1-20 % of severity), 4 genotypes observed as medium adult plant resistance (21-40% of severity) and 9 genotypes observed as low adult plant resistance (>41% of yellow rust severity), for stem rust 44 genotypes showed high adult plant resistance (1-20 % of severity), 8 genotypes observed as medium adult plant resistance (21-40 % of severity) and 12 genotypes observed as low adult plant resistance (>41% of stem rust severity). Tested genotypes showed diverse reactions for yellow and stem rust ranging from Resistance (R) to Susceptible (S) responses.
The regression analysis showed that when the yellow rust severity changes within a unit the grain yield decreased by 35.871 kg/ha and when the stem rust severity changes within a unit the grain yield decreased by 18.574 kg/ha. The correlation analysis also revealed that grain yield had negative significant correlation with yellow rust (r=-0.78) and stem (r=-0.67) disease severity and respectively. Grain yield and AUDPC of yellow and stem rust shown negative association. The value of AUDPC observed from 0 to 2380 and 0 to 2310 for yellow and stem rust respectively. Genotypes such as 57, 58 and 36 had the maximum AUDPC of yellow rust 2380, 2310 and 2275 respectively, but the grain yield of these genotypes were low, 1.03 t/ha, 0.97 t/ha and 1.13 t/ ha respectively. Whereas, genotypes 2 and 46 had maximum grain yield 6.07 t/ha and 5.67 t/ha with low AUDPC value 35 and 0 respectively. Genotypes such as 40, 6 and 57 had the maximum AUDPC of stem rust 2310, 2240 and 2100 respectively, however the grain yield of these genotypes were low, 1.7 t/ ha, 1.28 t/ha and 1.74 t/ha respectively. On the other hand, Genotypes 30 and 4 had maximum grain yield 3.94 t/ha and 3.85 t/ha with low AUDPC value 0 and 21 respectively.
The authors would like to express gratitude for the financial support provided by Ethiopian Institute of Agricultural Research and we are also grateful to Kulumsa Agricultural Research Center for its support in providing experimental materials and site to conduct this study.
[Crossref] [Google Scholar] [PubMed]
[Crossref]
[Crossref] [Google Scholar] [PubMed]
Citation: Zewdu D, Yimam K. Evaluation of bread wheat (Triticum aestivum L.) genotypes for yellow and stem rust adult plant resistance and disease impact on grain yield. AGBIR.2024;40(2):974-979.
Received: 29-Jan-2024, Manuscript No. AGBIR-24-126236 ; Accepted: 28-Feb-2024, Pre QC No. AGBIR-24-126236 (PQ); Editor assigned: 31-Jan-2024, Pre QC No. AGBIR-24-126236 (PQ); Reviewed: 14-Feb-2024, QC No. AGBIR-24-126236 ; Revised: 21-Feb-2024, Manuscript No. AGBIR-24-126236 (R); , DOI: 10.35248/0970-1907.24.40.974-979
Copyright: This open-access article is distributed under the terms of the Creative Commons Attribution Non-Commercial License (CC BY-NC) (http:// creativecommons.org/licenses/by-nc/4.0/), which permits reuse, distribution and reproduction of the article, provided that the original work is properly cited and the reuse is restricted to noncommercial purposes. For commercial reuse, contact reprints@pulsus.com This is an open access article distributed under the terms of the Creative Commons Attribution License, which permits unrestricted use, distribution, and reproduction in any medium, provided the original work is properly cited.


