Agricultural and Biological Research
RNI # 24/103/2012-R1
Research Article - (2024) Volume 40, Issue 2
Most soils in Burkina Faso are tropical ferruginous soils, characterized by poor structural stability of the surface horizons due to their high content of fine silt and sand. For this reason, the sesame variety S42 was studied under field conditions with mineral fertilization. The overall objective was to determine the dose combination of Nitrogen, Phosphorus and Potassium (NPK) mineral fertilizer and urea that would optimize sesame production. To this end, a trial was conducted using a Randomized Complete Block design (RCB). The following treatments were applied: T0: 0 kg/ha fertilizer (control), T1: 50 kg/ha urea, T2: 50 kg/ha NPK, T3: 50 kg/ha NPK+50 kg/ha urea, T4: 100 kg/ha NPK, T5: 100 kg/ha NPK+50 kg/ha urea, T6: 150 kg/ha NPK and T7: 150 kg/ha NPK+50 kg/ha urea. The results showed that fertilizer treatments had no effect on emergence date or cycle length, but treatments T5, T6 and T7 lengthened the start of flowering and the 50% flowering date by one day. Treatment T7 produced the tallest plants (150.3 cm/plant), the most vigorous (20.9 mm at crown) and the highest above-ground dry biomass (77 g/plant). Treatments T5, T6 and T7 produced one more branch. Treatments T4 and T6 produced the highest root dry biomass (19.8 g/plant). Treatments T7 (203.7 capsules) and T5 (191.1 capsules) produced more capsules per plant. There were no significant differences between treatments in terms of number of nodes, capsule size or 1000-seed weight. Plants from treatments T7 (76.2 seeds/capsule), T6 (75.2 seeds/capsule) and T5 (76 seeds/capsule) produced more seeds per capsule. Treatment T7 produced the highest seed yield (41.5 g/plant) and the highest harvest index (0.44). It is therefore recommended.
Sesame; NPK; Urea; Flowering, Growth; Yield
In Burkina Faso, sesame cultivation has become a real craze, reflected in its very rapid expansion nationwide in recent years [1]. The third-largest sector in terms of value, accounting for 26.5% of total exports from the country’s growth sectors, the crop is grown by 1,500,000 farmers. The area sown has increased from 93,384 ha in 2009 to around 350,000 ha in 2022 [2]. However, only five of the country's thirteen regions-Boucle du Mouhoun, East, Centre-West, cascades and Centre-Sud-produce around 78.55% of national output [3]. Unfortunately, Burkina Faso’s agriculture faces enormous difficulties, including low land productivity and precarious climatic conditions. According to Pieri [4], most soils in Burkina Faso are tropical ferruginous soils, characterized by poor structural stability of the surface horizons due to their high content of fine silt and sand. Continued exploitation of these soils has led to a rapid deterioration in their fertility, resulting in lower crop yields. The work of Cou-libaly, et al., [5] shows falls in carbon, assimilable phosphorus and pH levels of 76.83%, 82.48% and 3.88% respectively after 10 years of cultivation. Growing cereals in certain areas of Burkina Faso requires soil fertility management in order to obtain higher yields. Soil fertility management is generally achieved through the use of organic and mineral fertilizers, as well as production systems (crop rotation, intercropping and agroforestry) management techniques (stone cordon) and till-age techniques such as ‘zaï’ and subsoiling. Research, including that of Min-ingou, et al., [6], has shown that the mineral fertilizer (14N, 23P205, 14K20, 6S+1B) used for cotton production in Burkina Faso can be used at a rate of 100 kg/ha to obtain good sesame yields. The present study aims to provide another soil amendment alternative for optimizing sesame production using dose combinations of NPK mineral fertilizer and urea. Specifically, the aim is to: (i) Evaluate the effect of dose combinations of NPK fertilizer and urea on sesame plant growth and development, (ii) Evaluate the effect of dose combinations of NPK fertilizer and urea on sesame yield and (iii) Identify the dose combination of NPK fertilizer and urea that gives the best sesame yields.
Plant material
The plant material used was the sesame variety S42, of Indian origin, originally called Jalgon 128, listed in Burkina Faso’s national catalog of agricultural varieties. This variety was chosen because it is adapted to the country's climatic conditions and has been identified as one of the highest-yielding and most widely grown in Burkina Faso. The characteristics of this variety are presented in Table 1.
| Variety | S42 |
|---|---|
| Origin | Inde |
| SC | White |
| LC | Green |
| FlC | White+slight purplish tint |
| HSLC | Very hairy |
| ED (DAS) | 3 |
| BFl (DAS) | 35 |
| DFl 50% (DAS | 37 |
| EFl (DAS) | 65 |
| CL (DAS) | 90 |
Note: SC: Seed Color; LC: Leaf Color; FlC: Flower Color; HSLC: Hairiness on Stem, Leaves and Capsules; ED: Emergence Date; BFl: Beginning of Flowering; DFl 50%: Date of 50% Flowering; EFl: End of Flowering; CL: Cycle Length; DAS: Day After Sowing.
Table 1: Some characteristics of the six sesame varieties.
Experimental site
The experiment was conducted at the Gampèla Agro-Pedagogical Research Station (Figure 1) located at longitude 12°22 W and latitude 12°25 N, some 20 km east of Ouagadougou (capital of Burkina Faso). The area’s climate is sudano-sahelian.
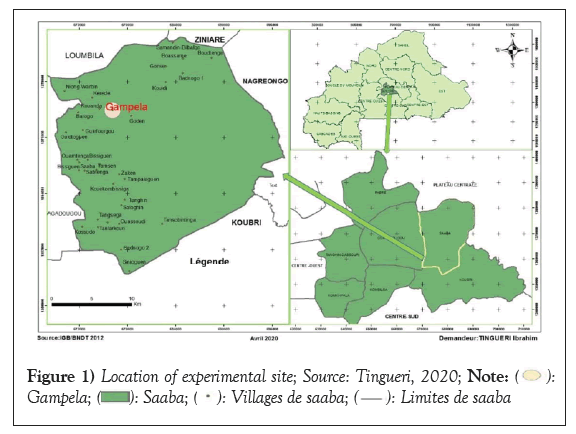
Figure 1: Location of experimental site; Source: Tingueri, 2020; 

Mineral and particle size composition of the study soil and rainfall at the study site
A sample of the upper soil horizon (0-20 cm) was taken from the field and analyzed at the laboratoire du Bureau National des Sols (BUNASOLS). The results of the soil analysis showed that the soil was slightly acidic (pH water=6.71), of sandy-loam texture with 74.51% sand, 15.69 silt and 9.80% sand (Table 2), of good mineralization with good nitrogen availability (C/N between 10 and 20), but poor in organic matter. In terms of rainfall, the cumulative total recorded from the beginning to the end of the experiment was 472 mm.
| Characteristics | Quantities | |
|---|---|---|
| Water pH | 6,71 | |
| Clay % | 9,80 | |
| Sandy-silty texture | Silt % | 15,69 |
| Sand % | 74,51 | |
| Apparent density | 1,60 | |
| C | 0,556 | |
| Organic matter (%) | OM | 0,959 |
| N | 0,038 | |
| C/N | 15 | |
| Organic matter (%) | Total P | 91,43 |
| Assimilable P | 35,83 | |
| Potassium (ppm) | Total K | 372,71 |
| K available | 203 | |
| Exchangeable bases (meq/100 g) | Ca2+ | 3,11 |
| Mg2+ | 0,72 | |
| K+ | 0,11 | |
| Na+ | 1,00 | |
| S | 4,94 | |
| CEC (meq/100 g) | 9,00 | |
| Saturation rate (%) | 55 | |
Note: C: Carbon; OM: Organic Matter; N: Nitrogen; C/N: Ratio of Carbon to Nitrogen; P: Phosphorus; K: Potassium; Ca2+: Calcium ion; Mg2+: Magnesium ion; K+: Potassium ion; Na+: Sodium ion; S: Sum of bases; CEC: Cation Exchange Capacity.
Table 2: Analytical characteristics of the soil sample.
Experimental set-up, sowing and plant maintenance
The experimental layout, covering an area of 241.2 m² (20.10 m × 12 m), was a randomized complete block design with three (03) replications. Each block consisted of eight elementary plots of 3.6 m² (3 m × 1.20 m) each. The distance between two blocks was the same as that between two plots in the same block and was 1.5 m. Plots were separated by a ridge to avoid fertilizer contamination. Each plot had three rows of seedlings, each 3 m long, with 0.60 m between rows and 0.20 m between bunches. The number of bunches per row was 16. Flat sowing to a depth of around 2 cm was carried out manually on July 25th 2019 on moist soil. A weeding with 2 plants per piquet was done on the 25th Day After Sowing (DAS) followed by a first weeding and a second weeding was done on the 47th DAS. Given sesame's susceptibility to insect attack, a "decis" insecticide treatment at a dose of 20 ml per 15 liters of water and at a rate of one liter per hectare was applied on the 55th day after sowing, in accordance with the manuel “technique de production de semences certifiées au Burkina”.
Treatments applied
The treatments consisted of soil amendment with NPK fertilizer formula 14 N, 23 P, 14 and urea. The NPK was applied at the vegetative stage (28 days after planting) to stimulate plant growth and development and the urea was applied at flowering (48 days after planting) to boost fruiting.
The following Treatments (T) were applied per elementary plot:
• T0: 0 kg/ha fertilizer (control),
• T1: 50 kg/ha of urea,
• T2: 50 kg/ha NPK,
• T3: 50 kg/ha NPK+50 kg/ha urea,
• T4: 100 kg/ha NPK,
• T5: 100 kg/ha NPK+50 kg/ha urea,
• T6: 150 kg/ha NPK,
• T7: 150 kg/ha NPK+50 kg/ha urea.
The choice of this fertilizer formula (14 N, 23 P and 14 K) is justified by the fact that it is the most widely used by growers, due to its accessibility on the market, as it is subsidized and recommended to growers by the Burkina Faso government.
Evaluation of parameters
The various treatments were evaluated in terms of phenological, morphological and agronomic parameters. Phenological observations were made at Emergence (ED), Beginning of Flowering (BFl), Date of 50% Flowering (DFl 50%) and Cycle Length (CL). For morphology, measurements included Diameter at Collar (CDM) using an electronic caliper, Plant Height (PHM) with a graduated ruler, Number of Nodes Before First Branching (NN-BFB), Number of Nodes Before the First Flower (NN-BFF) and the Number of Primary Branches (NPB) by manual counting, the Above-ground Dry Biomass (ADB), Root Dry Biomass (RDB) and Total Dry Biomass (TDB) using a 0.001 g precision electronic balance (Denver AC 1200D). The Number of Capsules per Branch (NCB), Number of Capsules per Main Stem (NCMS), Number of Capsules per Plant (NCP) and Number of Seeds per Capsule (NSC) were determined by manual counting. Capsule Length (CaL) and Capsule Diameter (CaD) were determined using the same electronic caliper mentioned above. 1000-Seed Weight (SW) was determined using the same scale mentioned above. Seed Yield per Plant (SYP) was calculated using the Garfius (1964) formula: W=XYZ (X: Number of bolls per plant; Y: Average number of seeds per boll; Z: Average seed weight). The Potential Yield per Hectare (PYH) was calculated according to the following formula: W × 66000 (66000 being the average density of plants per hectare). The Harvest Index per Plant (HIP) was calculated according to the formula: Ratio of the total weight of dry seeds from a plant to the total dry weight of the plant.
Data analysis
The data collected were entered using Excel 2016 spreadsheet software, which was also used to generate the graphs. Analysis of Variance (ANOVA) was performed using Rv.4.2.3 statistical software. To assess performance and differences between varieties across the different variables [7]. Means were compared using the Student-Newman-Keuls (SNK) test at the 5% probability threshold.
Phenological observations
Table 3 below shows the analyses of variance of the observations made on the different phases of plant development according to the different treatments. There was no significant difference (P=0.466) between treatments for Emergence (ED), which was 100% observed on the 3rd Day After Sowing (DAS). As for the Beginning of Flowering (BFl) and the Date of Flowering 50% (DFl 50%), significant differences (0.0371) and (P=0.031) were found between treatments respectively. Plants in treatments T7, T6 and T5 delayed the start of flowering and 50% flowering by one day more than the other treatments. There was no significant difference (p=0.466) between treatments for Cycle Length (CL), which occurred on 90 days for all plants in the different treatments.
| Treatments | Parameters | |||
|---|---|---|---|---|
| ED (DAS) | BFl (DAS) | DFl 50% (DAS) | CL (DAS) | |
| T0 | 3a | 35.00b | 37.00b | 90a |
| T1 | 3a | 35.33ab | 37.33ab | 90a |
| T2 | 3a | 35.33ab | 37.33ab | 90a |
| T3 | 3a | 35.67ab | 37.67ab | 90a |
| T4 | 3a | 35.33ab | 37.33ab | 90a |
| T5 | 3a | 36.00a | 38.00a | 90a |
| T6 | 3a | 36.00a | 38.0a | 90a |
| T7 | 3a | 36.33a | 38.33a | 90a |
| F value | 1 | 2.429 | 3.048 | 1 |
| P at 5% | 0.466NS | 0.0371* | 0.031* | 0.466NS |
Note: (*): Significant difference; NS: Non-Significant difference at the 5% threshold; F: Fisher's variable; P: Associated probability. A single letter for a parameter: Non-significant difference; Two letters for a parameter: Significant difference; ED: Beginning of Emergence; BFl: Beginning of Flowering; DFl 50%: Date of 50% Flowering; CL: Cycle Length; T0: 0 kg/ha fertilizer (control); T1: 50 kg/ha urea; T2: 50 kg/ha NPK; T3: 50 kg/ha NPK + 50 kg/ha urea; T4: 100 kg/ha NPK; T5: 100 kg/ha NPK+50 kg/ha urea; T6: 150 kg/ha NPK; T7: 150 kg/ha NPK+50 kg/ha urea; DAS: Day After Sowing.
Table 3: Analysis of variance of phenological characteristics according to treatments.
Morphological parameters
Analysis of variance for morphological traits revealed that: For the Plant Height (PHM) trait, a significant difference (P< 0.001) was revealed between treatments (Table 4 and Figure 2). Treatment T7 produced the tallest plants (150.3 cm/plant) compared with the control treatment T0, whose plants were around 114 cm tall. A significant difference (P<0.001) was found between treatments in terms of Diameter at Plant Collar (CDM) (Table 4 and Figure 3). Plants in treatment T7 had the largest diameters (20.9 mm on average) compared with plants in treatment T0 (approx. 14.3 mm). For the character’s Number of Nodes Before First Branching (NN-BFB) and Number of Nodes Before First Flowering (NN-BFF), no significant differences (P>0.05) were revealed between treatments (Table 4, Figures 4a and 4b). For the number of primary branches (Table 4 and Figure 5), a significant difference (P<0.001) was revealed between treatments. Treatments T5, T6 and T7 produced more branches (around 4 branches/plant) than treatments T0, T1 and T2 (around 3 branches/plant). For Above-ground Dry Biomass (ADB) and Root Dry Biomass (RDB) (Table 4, Figures 6a and 6b), significant differences were revealed between treatments (P=0.001) and (P=0.018) respectively. Treatment (T7) yielded the highest above-ground dry biomass (77 g/plant on average), while treatments T4 and T6 yielded the highest root dry biomass (around 19.8 g/plant). For total plant dry biomass (Table 4 and Figure 7), a significant difference (P=0.0217) was revealed between treatments. Treatment T7 yielded the highest total dry biomass (94.3 g/plant on average) compared with the control treatment T0, whose total dry biomass was around 85.7 g/plant.
| Treatments | Parameters | |||||||
|---|---|---|---|---|---|---|---|---|
| PHM (cm) | CDM (mm) | NN_BFB | NN_BFF | NPB | ADB (g) | RDB (g) | TDB (g) | |
| T0 | 114.0e | 14.3e | 4.2a | 5.6a | 3.1b | 68.9b | 17.2b | 85.7b |
| T1 | 120.9d | 15.0de | 4.4a | 6.1a | 3.3b | 68.7b | 18.2ab | 86.9ab |
| T2 | 131.2c | 15.3de | 4.4a | 6.3a | 3.0b | 68.3b | 19.3ab | 87.1ab |
| T3 | 139.5b | 16.3cd | 4.3a | 6.1a | 3.7ab | 73.1ab | 18.6ab | 92.2ab |
| T4 | 137.1bc | 15.9de | 4.1a | 6.3a | 3.7ab | 71.6ab | 19.8a | 90.9ab |
| T5 | 144.3b | 18.4b | 4.1a | 6.1a | 4.1a | 73.9ab | 19.2ab | 92.5ab |
| T6 | 143.2b | 17.5bc | 3.7a | 5.7a | 4.0a | 72.9ab | 19.8a | 92.3ab |
| T7 | 151.3a | 20.9a | 3.9a | 5.8a | 4.3a | 77.0a | 18.3ab | 94.3a |
| F value | 30.43 | 24.44 | 1.823 | 1.8 | 7.926 | 6.263 | 3.499 | 3.341 |
| P at 5% | < 0.001*** | < 0.001*** | 0.151NS | 0.156NS | <0.001*** | 0.001** | 0.018* | 0.0217* |
Note: (***): Very highly significant difference; (**): Highly significant difference; (*): Significant difference; NS: Non-Significant difference at 5% level; F: Fisher variable; P: Associated probability; One letter for a parameter: Non-significant difference; Two letters for a parameter: Significant difference; More than two letters for a parameter: Highly significant difference; PHM: Height of Plant at Maturity; CDM: Diameter at Crown at Maturity; NN_BFB: Number of Nodes Before First Branching; NN_BFF: Number of Nodes Before First Flowering; NPB: Number of Primary Branches per Plant; ADB: Above-ground Dry Biomass; RDB: Root Dry Biomass; TDB: Total Dry Biomass. T0: 0 kg/ha fertilizer (control); T1: 50 kg/ha urea; T2: 50 kg/ha NPK; T3: 50 kg/ha NPK+50 kg/ha urea; T4: 100 kg/ha NPK; T5: 100 kg/ha NPK+50 kg/ha urea; T6: 150 kg/ha NPK; T7: 150 kg/ha NPK+50 kg/ha urea.
Table 4: Analysis of variance of morphological characteristics according to treatments.
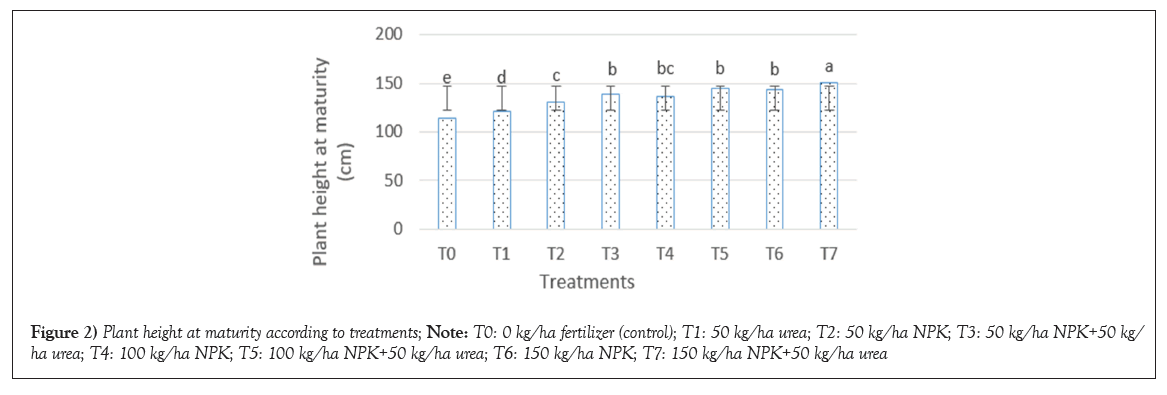
Figure 2: Plant height at maturity according to treatments; Note: T0: 0 kg/ha fertilizer (control); T1: 50 kg/ha urea; T2: 50 kg/ha NPK; T3: 50 kg/ha NPK+50 kg/ ha urea; T4: 100 kg/ha NPK; T5: 100 kg/ha NPK+50 kg/ha urea; T6: 150 kg/ha NPK; T7: 150 kg/ha NPK+50 kg/ha urea.

Figure 3: Collar diameter at maturity as a function of treatments; Note: T0: 0 kg/ha fertilizer (control); T1: 50 kg/ha urea; T2: 50 kg/ha NPK; T3: 50 kg/ha NPK+50 kg/ha urea; T4: 100 kg/ha NPK; T5: 100 kg/ha NPK+50 kg/ha urea; T6: 150 kg/ha NPK; T7: 150 kg/ha NPK+50 kg/ha urea.

Figure 4: (a): Number of nodes before first branching; (b): Number of nodes before first flowering; Note: T0: 0 kg/ha fertilizer (control); T1: 50 kg/ha urea; T2: 50 kg/ ha NPK; T3: 50 kg/ha NPK+50 kg/ha urea; T4: 100 kg/ha NPK; T5: 100 kg/ha NPK+50 kg/ha urea; T6: 150 kg/ha NPK; T7: 150 kg/ha NPK+50 kg/ha urea.

Figure 5: Number of primary branches according to treatments; Note: T0: 0 kg/ha fertilizer (control); T1: 50 kg/ha urea; T2: 50 kg/ha NPK; T3: 50 kg/ha NPK+50 kg/ha urea; T4: 100 kg/ha NPK; T5: 100 kg/ha NPK+50 kg/ha urea; T6: 150 kg/ha NPK; T7: 150 kg/ha NPK+50 kg/ha urea.

Figure 6: (a): Above-ground; (b): Root dry biomass as a function of treatments; Note: T0: 0 kg/ha fertilizer (control); T1: 50 kg/ha urea; T2: 50 kg/ha NPK; T3: 50 kg/ha NPK+50 kg/ha urea; T4: 100 kg/ha NPK; T5: 100 kg/ha NPK+50 kg/ha urea; T6: 150 kg/ha NPK; T7: 150 kg/ha NPK+50 kg/ha urea.
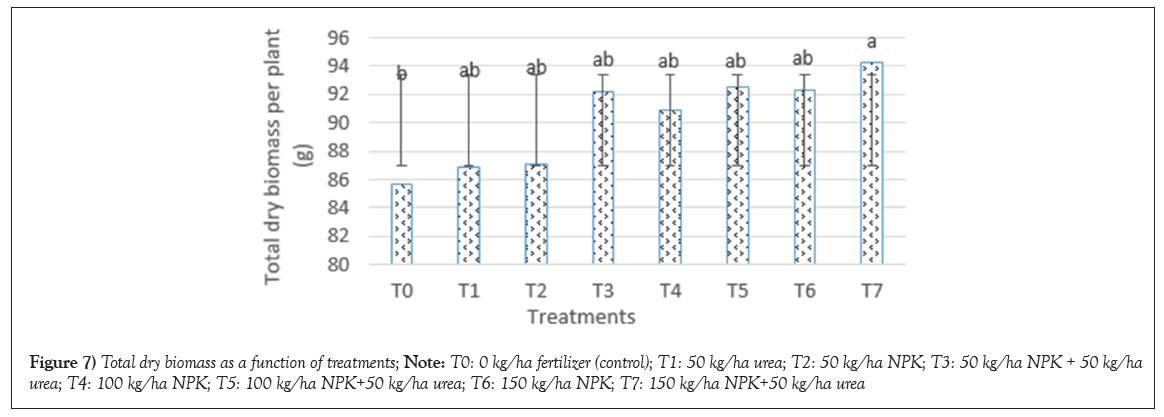
Figure 7: Total dry biomass as a function of treatments; Note: T0: 0 kg/ha fertilizer (control); T1: 50 kg/ha urea; T2: 50 kg/ha NPK; T3: 50 kg/ha NPK + 50 kg/ha urea; T4: 100 kg/ha NPK; T5: 100 kg/ha NPK+50 kg/ha urea; T6: 150 kg/ha NPK; T7: 150 kg/ha NPK+50 kg/ha urea.
Agronomic parameters
The analysis of variance of agronomic parameters is presented in the following (Table 5): For the Number of Capsules per Main Stem (NCMS) and the Number of Branch Capsules (NCB), highly significant differences were revealed between treatments (P<0.001) and (P=0.003) respectively. Treatments T7 (116.8 capsules) and T5 (112.2 capsules) yielded more capsules per main stem and the same treatments T7 (87 capsules) and T5 (78 capsules) yielded more capsules on branches (Table 5 and Figures 8a and 8b). For the Number of Capsules per Plant (NCP), a highly significant difference (P<0.001) was revealed between treatments. The same treatments, T7 (203.7 capsules) and T5 (191.1 capsules), still produced more capsules per plant (Table 5 and Figure 9). For Capsule Length (CaL) and Capsule Diameter (CaD), no significant differences were revealed between treatments (P=0.407) and (P=0.209) respectively (Table 5 and Figure 10a and 10b). For the Number of Seeds per Capsule (NGC), a highly significant difference (P<0.001) was revealed between treatments. Plants from treatments T7 (76.2 seeds/capsule), T6 (75.2 seeds/capsule), T5 (76 seeds/capsule) and T3 (75.4 seeds/capsule) produced the most seeds per capsule (Table 5 and Figure 11). No significant difference (P=0.367) was found between treatments for 1000-seed weight (Table 5 and Figure 12). For Seed Yields per Plant (SYP) and per hectare, the same highly significant difference (P<0.001) was revealed between treatments. Treatment T7 gave the highest yields per plant (41.5 g) and per hectare (2739.7 kg) (Table 5 and Figures 13a and 13b). For the Harvest Index (HI), a highly significant difference (P<0.001) was revealed between treatments (Table 5 and Figure 14). Treatment T7 yielded the highest index (0.44) compared with control treatment T0 (0.35).
| Treatments | Parameters | |||||||||
|---|---|---|---|---|---|---|---|---|---|---|
| NCMS | NCB | NCP | CaL (mm) | CaD (mm) | NSC | TSW (g) | SYP (g) | SYH (kg) | HIP | |
| T0 | 93.5c | 67.0b | 160.5d | 26.1a | 8.6a | 68.6d | 2.78a | 30.5d | 2014.3d | 0.35d |
| T1 | 84.0d | 70.3b | 160.7d | 26.8a | 8.6a | 70.3cd | 2.76a | 31.4d | 2046.0d | 0.36cd |
| T2 | 95.2c | 67.8b | 163.7cd | 27.4a | 8.7a | 73.3bc | 2.77a | 32.2d | 2126.7d | 0.37cd |
| T3 | 102.1bc | 73.9b | 176.0cd | 27.9a | 8.7a | 75.4a | 2.83a | 37.2b | 2455.0b | 0.40b |
| T4 | 102.4bc | 69.3b | 174.7cd | 27.7a | 8.9a | 74.1ab | 2.80a | 34.8c | 2298.3c | 0.38c |
| T5 | 112.2a | 78.9ab | 191.1b | 28.0a | 9.1a | 76.0a | 2.85a | 39.4b | 2601.5b | 0.43ab |
| T6 | 104.9b | 74.0b | 178.9c | 27.9a | 9.1a | 75.2a | 2.84a | 38.15b | 2517.9b | 0.41b |
| T7 | 116.8a | 87.0a | 203.7a | 28.7a | 9.3a | 76.2a | 2.90a | 41.5a | 2739.7a | 0.44a |
| F value | 22.05 | 5.212 | 15.7 | 1.103 | 1.591 | 13.66 | 1.18 | 34.6 | 34.6 | 23.75 |
| P at 5% | <0.001*** | 0.003** | <0.001*** | 0.407NS | 0.209NS | <0.001*** | 0.367NS | <0.001*** | <0.001*** | <0.001*** |
Note: (***): Very highly significant difference; (**): Highly significant difference; (*): Significant difference; NS: Non-Significant difference at 5% level; F: Fisher variable; P: Associated probability; One letter for a parameter: Non-significant difference; Two letters for a parameter: Significant difference; More than two letters for a parameter: Highly significant difference; NCMS: Number of Main Stem Capsules; NCB: Number of Branch Capsules per Plant; NCP: Number of Capsules per Plant; CaL: Capsule Length; CaD: Capsule Diameter; NGC: Number of Seeds per Capsule; TSW: Thousand Seed Weight; SYP: Seed Yield Plant; SYH: Potential Seed Yield per Hectare; HIP: Harvest Index per Plant. T0: 0 kg/ha fertilizer (control); T1: 50 kg/ha urea; T2: 50 kg/ha NPK; T3: 50 kg/ha NPK+50 kg/ha urea; T4: 100 kg/ha NPK; T5: 100 kg/ha NPK+50 kg/ha urea; T6: 150 kg/ha NPK; T7: 150 kg/ha NPK+50 kg/ha urea.
Table 5: Analysis of variance of agronomic characteristics according to treatments.
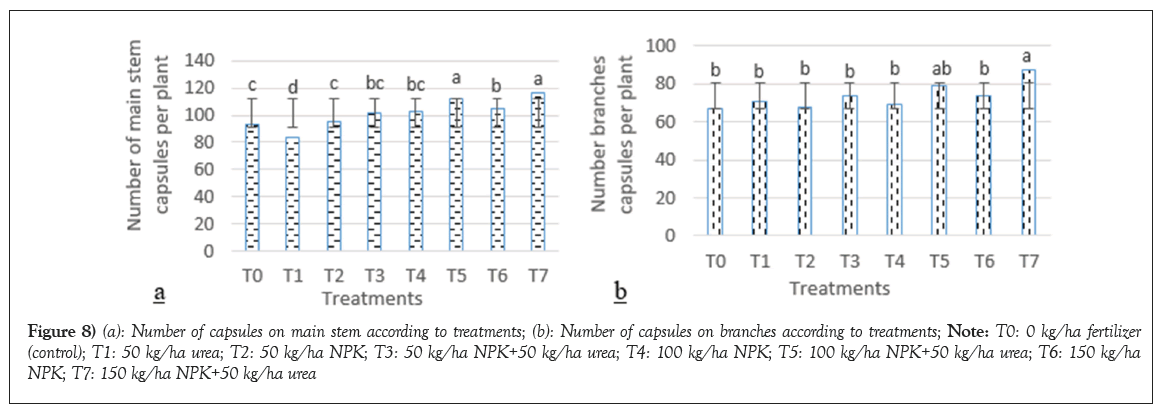
Figure 8: (a): Number of capsules on main stem according to treatments; (b): Number of capsules on branches according to treatments; Note: T0: 0 kg/ha fertilizer (control); T1: 50 kg/ha urea; T2: 50 kg/ha NPK; T3: 50 kg/ha NPK+50 kg/ha urea; T4: 100 kg/ha NPK; T5: 100 kg/ha NPK+50 kg/ha urea; T6: 150 kg/ha NPK; T7: 150 kg/ha NPK+50 kg/ha urea.
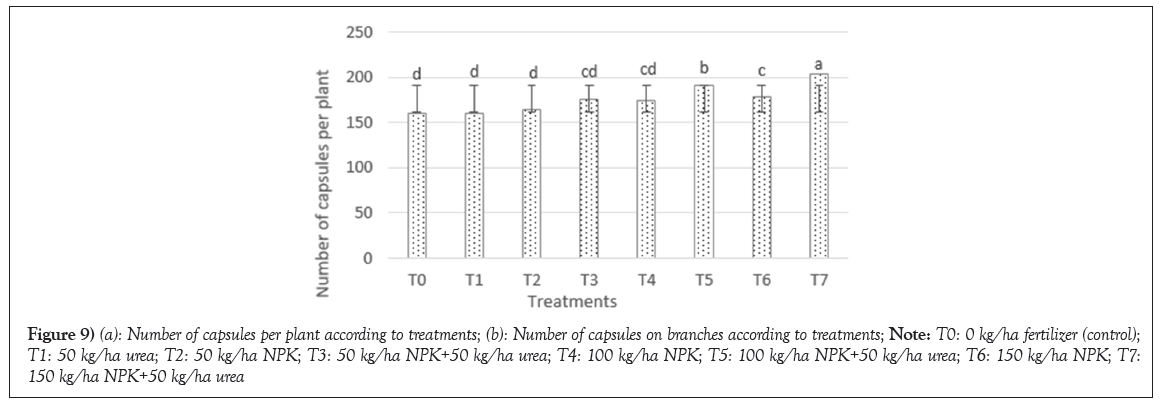
Figure 9: (a): Number of capsules per plant according to treatments; (b): Number of capsules on branches according to treatments; Note: T0: 0 kg/ha fertilizer (control); T1: 50 kg/ha urea; T2: 50 kg/ha NPK; T3: 50 kg/ha NPK+50 kg/ha urea; T4: 100 kg/ha NPK; T5: 100 kg/ha NPK+50 kg/ha urea; T6: 150 kg/ha NPK; T7: 150 kg/ha NPK+50 kg/ha urea.
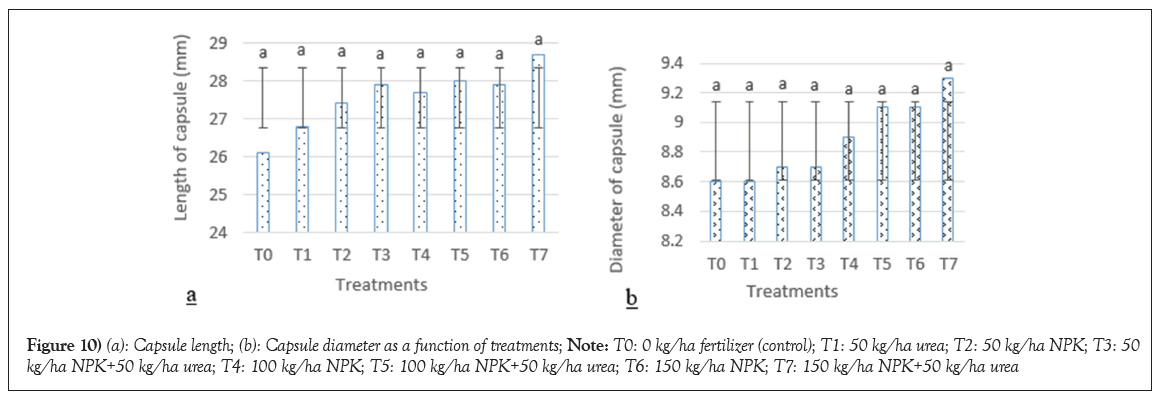
Figure 10: (a): Capsule length; (b): Capsule diameter as a function of treatments; Note: T0: 0 kg/ha fertilizer (control); T1: 50 kg/ha urea; T2: 50 kg/ha NPK; T3: 50 kg/ha NPK+50 kg/ha urea; T4: 100 kg/ha NPK; T5: 100 kg/ha NPK+50 kg/ha urea; T6: 150 kg/ha NPK; T7: 150 kg/ha NPK+50 kg/ha urea.

Figure 11: Number of seeds per capsule according to treatments; Note: T0: 0 kg/ha fertilizer (control); T1: 50 kg/ha urea; T2: 50 kg/ha NPK; T3: 50 kg/ha NPK+50 kg/ha urea; T4: 100 kg/ha NPK; T5: 100 kg/ha NPK+50 kg/ha urea; T6: 150 kg/ha NPK; T7: 150 kg/ha NPK+50 kg/ha urea.
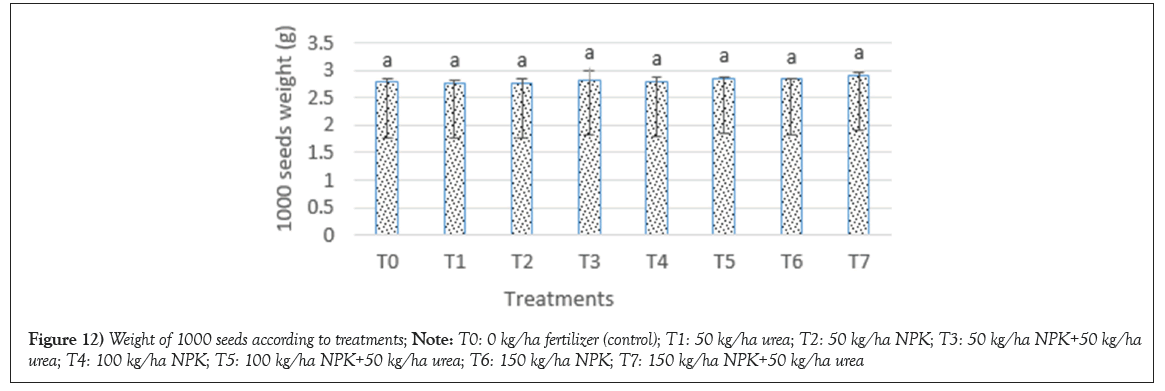
Figure 12: Weight of 1000 seeds according to treatments; Note: T0: 0 kg/ha fertilizer (control); T1: 50 kg/ha urea; T2: 50 kg/ha NPK; T3: 50 kg/ha NPK+50 kg/ha urea; T4: 100 kg/ha NPK; T5: 100 kg/ha NPK+50 kg/ha urea; T6: 150 kg/ha NPK; T7: 150 kg/ha NPK+50 kg/ha urea.

Figure 13: (a): Seed yields; (b): Yields per hectare according to treatments; Note: T0: 0 kg/ha fertilizer (control); T1: 50 kg/ha urea; T2: 50 kg/ha NPK; T3: 50 kg/ha NPK+50 kg/ha urea; T4: 100 kg/ha NPK; T5: 100 kg/ha NPK+50 kg/ha urea; T6: 150 kg/ha NPK; T7: 150 kg/ha NPK+50 kg/ha urea.
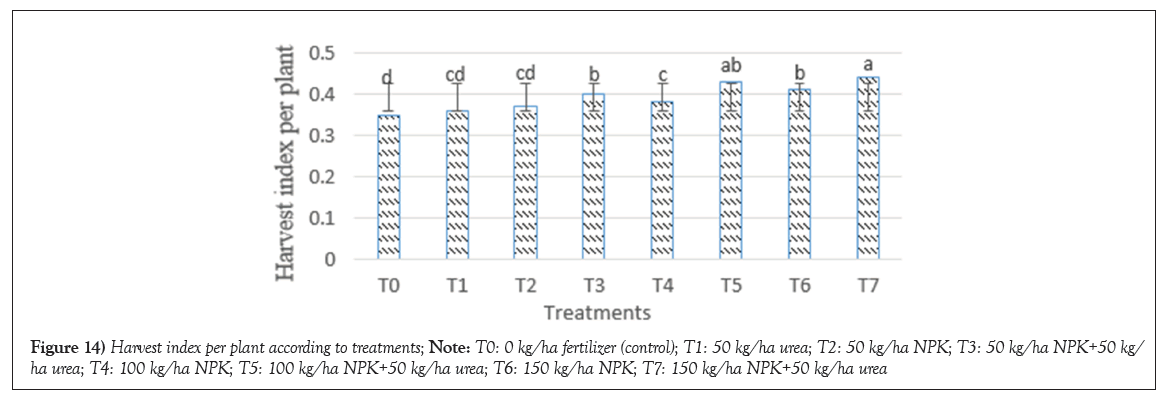
Figure 14: Harvest index per plant according to treatments; Note: T0: 0 kg/ha fertilizer (control); T1: 50 kg/ha urea; T2: 50 kg/ha NPK; T3: 50 kg/ha NPK+50 kg/ ha urea; T4: 100 kg/ha NPK; T5: 100 kg/ha NPK+50 kg/ha urea; T6: 150 kg/ha NPK; T7: 150 kg/ha NPK+50 kg/ha urea.
Analyses of variance of the observations made on the different phases of seedling development according to the different treatments revealed no significant difference between treatments for emergence, which was 100% observed on the 3rd day after sowing. In fact, sesame seed emergence is linked to soil humidity and temperature conditions. These conditions were optimal, as Ily [8] reported that the duration of sesame emergence can vary from 3 to 10 days after sowing, depending on soil temperature and humidity. As for the start of flowering and the 50% flowering date, significant differences were observed between treatments. Treatments T5: 100 kg/ha of NPK+50 kg/ha of urea, T6: 150 kg/ha of NPK and T7: 150 kg/ha of NPK+50 kg/ha of urea, with the highest quantities of fertilizers, shifted the start of flowering and the 50% flowering date by one day more than the other treatments. These results are in line with those of 9. Teshome [9] on mineral fertilization of sesame. This author reported an increase in the number of days to onset and 50% flowering of sesame following the application of increasing doses of Nitrogen and Phosphorus fertilizers (NP). In fact, higher fertilizer levels allow greater vegetative development of the plants, thus delaying flowering. On the other hand, an excess of nitrogen leads to delayed or absent flowering due to the excessive lengthening of the vegetative period. Yeboua, et al., [10] in contrast, there was no significant difference between treatments in terms of cycle length, which was 90 JAS for all plants in the different treatments. Indeed, sesame variety S42 is said to be precocious and its cycle length did not vary significantly whatever the soil amendment used for cultivation. This corroborates the results of previous authors including Ily [8], Boureima, et al., [11] and Badiel [12] on this variety who reported the same cycle length of 90 JAS. The same treatments T5: 100 kg/ha NPK+50 kg/ha urea, T6: 150 kg/ha NPK and T7: 150 kg/ha NPK+50 kg/ha urea produced the tallest, most vigorous and most branched plants. These results are in line with those of Miningou, et al., [6] and Jakusko, et al., [13] who reported an increase in sesame plant height and branching following the application of increasing doses of NPK fertilizers. These results are also in line with those of Teshome [9] and El Mahdi, et al., [14] who applied increasing doses of NP fertilizers to the same plant. This is explained by the greater availability of the mineral elements essential to plant growth and development, namely nitrogen, phosphorus and potassium, provided by these treatments. Nitrogen increases photosynthetic pigment content and the rate of photosynthesis, which in turn increases the quantity of metabolites synthesized, leading to greater growth. Miningou, et al., [6] also report that the longer the plant grows, the greater the branching potential of the main stem. The number of nodes before the first flower and before the first branching did not change following different doses of mineral fertilizers. The lack of variation in these parameters would seem to be linked more to the variety than to environmental factors. However, the insertion height of the first boll increased with increasing doses of NP fertilizers.
In terms of agronomic parameters, treatments T7: 150 kg/ha NPK+50 kg/ha urea and T5: 100 kg/ha NPK+50 kg/ha urea produced more bolls on the main stem and branches. Authors such as Shehu, et al., [15] have reported significant increases in the number of sesame bolls following the application of increasing doses of NPK. This is explained by the fact that high doses of NPK make available to plants so-called major elements such as phosphorus, which stimulates flowering and fruiting and potassium, which enhances fruiting Miningou, et al., [6]. The addition of urea to NPK fertilizer further increases the availability of nitrogen to the plant and further increases boll production, since nitrogen is the main factor in plant growth [16]. Capsule length and diameter were not increased by the various mineral treatments. This could be explained by the fact that, under satisfactory nutritional conditions, sesame tends to produce more bolls than boll dimensions. Plants from treatments T7, T6 and T5 produced more seeds per capsule. These results are in line with those of other authors such as Muhammad, et al., [17] who reported that an increase in nitrogen levels favors an increase in the number of seeds per sesame capsule. Similarly, Okpara, et al., [18] found that the application of high doses of phosphorus increased the number of seeds per sesame capsule. Malik, et al., [19] reported that the application of high doses of nitrogen increased the number of seeds per capsule. Plants from treatment T7 had the highest seed yield and the highest harvest index. A harvest index is an indicator of a higher seed yield than dry biomass and therefore a better accumulation of assimilates in the seeds, which would result from optimum fertilizer application. Miningou, et al., [6] report that the improvement in seed yield is due to higher values for growth parameters (plant height, stem collar diameter and number of branches per plant) and yield-attributing traits (number of bolls per plant, number of seeds per boll and seed weight). We can therefore affirm that the combination of NPK and urea fertilizer doses provided by treatment T7: 150 kg/ha NPK+50 kg/ha urea are optimal for maximum production of this sesame variety on the basis of the strong increase in yield compared with plants from unamended soil and with plants from soil amended with either NPK alone or urea alone.
At the end of this study on the sesame variety S42, it was found that fertilizer treatments had no effect on emergence date or cycle length, but treatments T5, T6 and T7 lengthened the start of flowering and the 50% flowering date by one day. Treatment T7 produced the tallest, most vigorous plants and the highest above-ground dry biomass. Treatments T5, T6 and T7 produced one more branch than the other treatments. Treatments T4 and T6 produced the highest root dry biomass. Treatments T7 and T5 produced more capsules per plant. There were no significant differences between treatments in terms of number of nodes, capsule size or 1000-seed weight. Plants from treatments T7, T6 and T5 produced more seeds per capsule. Treatment T7 produced the highest seed yield and harvest index. Treatment T7 was also identified as the best amendment. It is therefore recommended for optimum sesame production.
Citation: Badiel B, Nana R, Ouedraogo RF, et al. Effect of mineral fertilizer combinations on physiological and agronomic performance of sesame (Sesamum indicum L.) in Burkina Faso. AGBIR.2024;40(2):910-918.
Received: 16-Jan-2024, Manuscript No. AGBIR-24-125133 ; , Pre QC No. AGBIR-24-125133 (PQ); Editor assigned: 18-Jan-2024, Pre QC No. AGBIR-24-125133 (PQ); Reviewed: 01-Feb-2024, QC No. AGBIR-24-125133 ; Revised: 08-Feb-2024, Manuscript No. AGBIR-24-125133 (R); Published: 15-Feb-2024, DOI: 10.35248/0970-1907.24.40.910-918
Copyright: open-access article is distributed under the terms of the Creative Commons Attribution Non-Commercial License (CC BY-NC) (http:// creativecommons.org/licenses/by-nc/4.0/), which permits reuse, distribution and reproduction of the article, provided that the original work is properly cited and the reuse is restricted to noncommercial purposes. For commercial reuse, contact reprints@pulsus.com This is an open access article distributed under the terms of the Creative Commons Attribution License, which permits unrestricted use, distribution, and reproduction in any medium, provided the original work is properly cited.
