An International Journal
Agricultural and Biological Research
ISSN - 0970-1907
RNI # 24/103/2012-R1
RNI # 24/103/2012-R1
Research Article - (2025) Volume 41, Issue 1
The management of the Pendjari biosphere reserve is subject to several limits and restrictions that modify the cultural behavior of the surrounding populations. This study examines the factors determining the choice of crops in the biosphere reserve, within a regulatory context defined and applied by the designated management bodies. The data concerns a total of 600 growers and was collected using a Kobotoolbox digitized questionnaire. Descriptive statistics were used for socio-demographic characteristics, with Pearson's chi2 test for the relationship between categorical variables and study communes and Student's t-test for the relationship between categorical variables and communes. The multinomial logit regression model was used to identify the factors influencing the choice of crops (maize, soybean, sesame) in relation to the staple crop of cotton. The results show that socio economic characteristics vary according to the communes in the study. The variables: Number of farm workers, farming experience, level of education, access to credit and extension advice, membership of an organization, ethnicity of the producer, change of activity and access to land are the major determinants of the choice of crops around the reserve. This suggests that any intervention aimed at promoting sustainable agricultural diversification around the reserve should take account of socio-economic, human and land-related realities and constraints. An integrated approach that takes account of these different dimensions will be essential to support more diversified crop choices that are resilient to the regulatory challenges of the Pendjari reserve.
Rules, Management, Choices, Crops, Biosphere reserve
The PBR's World Heritage status gives it paramount importance in terms of biodiversity conservation. As a result, responsibilities fall to the Country in terms of enhanced protection measures for the preservation of the reserve's ecological integrity. According to Duda and Gallois, human presence, particularly hunting and poaching activities, can greatly disrupt animal population behavior and dynamics. In addition, the use of pesticides and other chemicals in adjacent agricultural areas represents a threat to the reserve's flora and fauna. Vodouhe, et al., show that the intensive use of these inputs contributes to the destruction of the vegetation cover, even though it constitutes an alternative to bush fires. In this context, Assogba, et al., stress the importance of reconciling conservation imperatives with the needs of local populations, in order to ensure sustainable management of this exceptional natural heritage [1].
Moreover, the livelihood of the people living around the reserve depends in part on agriculture. This activity enables them to ensure their food security and supplement their livelihoods. Consequently, access to fertile farmland and natural resources such as water, wood and grazing land is necessary for food production and small-scale livestock farming. However, these agricultural activities are subject to special regulations. The PBR is subject to rigorous management aimed at preserving biodiversity. Houessou, et al., point out that the reserve's management authorities are working with these communities to encourage the adoption of more sustainable farming techniques, such as agroforestry or the rational use of chemical inputs. But this is no easy task, not only because the practices advocated require much greater effort and resources, but also because the workforce is becoming increasingly scarce due to migration and exodus.
These challenges of cohabitation with PBR are leading local residents to choose practices and model their behavior in order to better adapt to their environment. These practices include cultivation choices. Competition for access to and use of natural resources, particularly land, leads to competition between cash crops and food crops grown by people living near reserves. Ndami points out that the dynamics of land appropriation favored by the boom in cash crops may have come into tension with the rights to use and cultivate land intended for food crops. It is important to understand the factors influencing the choice of crops grown around the reserve. This will enable us to better face the challenge of the struggle for food security [2].
Thus, this article sheds light on the question: What are the determinants of farmers' crop choices around the Pendjari Biosphere Reserve in northern Benin? It basically answers two specific questions, namely:
• What crops are grown around the PBR?
• What are the factors determining cropping choices around the PBR?
This research examines the complex interactions between biodiversity conservation, agricultural development and the needs of local communities, which is of paramount importance for the sustainable management of this protected area.
Theoretical framework
This research is based on the theories of rationality and rational choice. These are fundamental concepts of economics, based on the assumption that economic agents are rational. Based on the principles of rational choice, these theories postulate that producers make decisions to maximize their utility or profits. We speak of economic rationality when the behavior of individuals corresponds to their interests: agents are supposed to act in such a way as to optimize their well-being. This well-being is often calculated with a utility function that takes into account income and the time allocated to other activities. It is closely related to rational addiction theory, which views addictive behavior as a rational, forward looking plan rather than a purely impulsive act [3].
In addition, the post-Keynesian perspective on producer choice, which includes concepts such as bounded optimization and environmentally friendly rationality, aligns with the principles of rational producer choice. Rational choice theory, at the heart of economic, political and social sciences, underpins the understanding of decision making processes and behaviors in a variety of disciplines. Growers' choice of crops will be made according to a logic that may relate not only to the grower's reasoning with regard to PBR management methods, but also to socio-economic and demographic characteristics, as well as to his environment. They make their choice following a decision making process that they stop once satisfaction has been reached [4].
Study area
The Pendjari biosphere reserve is located in North-West Benin, more precisely in the Atacora region, on the territories of the Tanguieta, Materi and Kerou communes. It is one of the reserves that provides the population with products for human and animal consumption, traditional medicine, timber, energy and agroforestry. With an area of around 5,053 km², it is part of the WAP (W-Arly-Pendjari) complex, one of the largest protected area complexes in West Africa. This reserve is home to a rich biodiversity, including a wide variety of wild mammal species. It has a dry Sudano-Guinean climate influenced by the Atacora mountain range. The study of land tenure issues and cropping choices in the Pendjari Biosphere Reserve in Benin is of specific interest due to the reserve's ecological importance, the coexistence of local populations, demographic and land tenure pressures, as well as the reserve's management (Figure 1) [5].
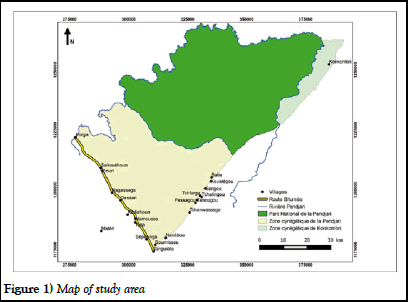
Figure 1) Map of study area
Sampling
The research observation unit is the household head. Based on the list of producers around the reserve that exists in the communal office of Materi and Tanguieta, a sample of 600 producers was selected at simple random, 300 per commune. In concrete terms, a unique code was assigned to each household according to the list obtained from the management committee's census of local residents, then a random number generator was applied to select the respondents to whom the questionnaire was administered [6].
Data collection
Data collection was carried out in November 2023 using a semi-structured interview with a Kobotoolbox digitalized questionnaire. The period chosen was the best time of the year for interviews, as most growers work in the field during the dry season. The questionnaire was pre-tested. During this test, the interviewers were trained on how to administer the questions to collect information while limiting bias. Two categories of data were collected. Firstly, data relating to the socio economic and demographic characteristics of producers (gender, age, level of education, ethnic group, group membership, contact with extension services, access to credit, household size, number of agricultural assets). Secondly, data on the different crops grown and the reasons for choosing them were collected. Reasons for crop choice were collected using open ended questions [7-9].
Data analysis
Descriptive statistics (mainly averages) were used to identify the four main crops in terms of area sown in the research area. The averages of all crops were calculated in order to prioritize the crops produced in the study area. Then the explained variable (main crops) was constituted by selecting for each producer using the “max” command on stata to generate in a new variable, the crop with the maximum area while taking into account the order of crops. In the event of some crops being equal, the rank according to the average area is applied. Multinomial Logit was used to identify the determinants of farmers' cropping choices. It is based on the modeling of growers' behavior according to various alternatives. It is the most appropriate model for this type of analysis. It has the advantage of allowing a relaxation of the hypothesis of independence of alternatives. The farm perceives a utility in opting for a crop or not [10]. This utility is expressed by the following mathematical formula:
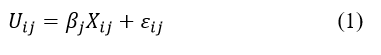
Uij represents the utility of farmer i to opt for a crop j, ½ represents the constant, X=1, 2, 3.......k are the explanatory variables of the model and represents the random factors that are not under the control of the farmer. Farmer i utility is associated with a probability expressed as follows:

P represents the associated probability and Y ij being the explained variable that takes the value 1 if producer i opts for alternation j and 0 if not. Multinomial Logit subjects the producer to disjoint and exhaustive alternatives represented by the explained variable which constitutes the choice of a crop. The cotton crop is chosen here as the reference modality not only because it is the only cash crop among the main crops, but also because the restrictions around the reserves advocate the preservation of the biosphere. Cotton is known for its high dependence on chemical inputs. The idea is to highlight the factors that may lead my producers to opt for a crop other than cotton [11-13].
Several research studies have identified socio economic and demographic characteristics as choice criteria. These are mainly property rights, farm size, mode of access to land, farm production experience, age of the head of household, gender and level of education and income. In this study, only marginal effects were interpreted [14,15].
Based on the literature, potential variables determining cropping choices include socio-economic and demographic characteristics. It's all about:
Access to land and mode of access to land: Access to land and mode of access to land can influence producers' choice of crops. According to Deininger and Xia, producers who owned their land were more inclined to adopt cash crops, while those who rented their land opted more for food crops such as maize and cassava [16].
Main purpose of production: Ritzema, et al., showed that famers whose primary objective was household food security tended to grow a wider variety of crops, including staples such as maize. This variable may favor the adoption of one crop over another. Thus, both signs are expected.
Ethnicity: Different ethnic communities with distinct historical and cultural ties to the region may have different perceptions of land legitimacy, access and management. Moreover, nutritional preferences have a significant influence on people's cropping choices. The variable would take on both positive and negative signs [17].
Farming experience: According to Yessifou, et al., farming experience has an effect on adoption choices. Thus, farming experience can have both positive and negative effects on cropping choices. Similarly, Asrat, et al., have shown that the number of years of farming experience is one of the main factors behind heterogeneity in household crop variety preferences.
Access to credit: Access to credit can have a positive influence on the producer's choice of certain innovations or technologies and a negative one for others. Access to credit increases the share of land devoted to legumes and cereal crops, while it reduces the share of land devoted to tuber crops and cash crops. The expected sign can be positive or negative, depending on the producer's perception or objective [18].
Agricultural asset: The agricultural asset in the household has a positive influence on the adoption of a practice. It can have both a positive and a negative effect on the cultural choice of the head of household.
Main activity and share of income from farming: the main activity is an important factor in farmers' decisions about which crops to adopt. Furthermore, the share of income derived from farming can influence growers' choice of crop. Stoeffler, have shown that income is a factor determining crop choice, with richer households having different preferences from poorer households. Thus, the share of income derived from farming is an important factor in farmers' decision making about which crops to adopt.
Change of activity: Changes in farm activities, such as diversification or reconversion, can prompt producers to choose crops better suited to their new skills, resources and production goals [19-21].
Membership of a group and contact with an agent: According to Teno, et al., membership of an association has a positive effect on the adoption of a new crop, while Bidan, et al., noted that the frequency of extension agent’s influences crop choice. The group or the extension agents may be promoters of a specific crop. The information and capacity-building they provide can lead the farmer to adopt the crop. These variables can have both positive and negative effects on crop choice.
Level of education and literacy: the level of education is considered to be a variable favoring the choice of an innovation. The same applies to literacy status. Conferring on farmers a certain ability to inform themselves and evaluate their choices, these factors enable farmers to better anticipate choice related gains (Table 1) [22-25].
|
Variables |
Description |
Coding |
Signe |
|
MACT |
Land access mode |
Categorical variable |
+ |
|
EXP |
Number of years of farming experience |
Continuous variable |
± |
|
BPPROD |
Main purpose of your production |
Categorical variable |
± |
|
OBTENC |
Access to credit |
Binary variable (0-No, 1-Yes) |
± |
|
AOG |
Group/Association membership |
Binary variable (0-No, 1-Yes) |
± |
|
RCVA |
Contact with an extension agent (government and/or NGO) |
Binary Variable (0-No, 1-Yes) |
± |
|
LEDUC |
Level of education |
Categorical variable |
+ |
|
TNFEDUC |
Non-formal education |
Binary variable (0-No, 1-Yes) |
+ |
|
ETHNIQUE |
Ethnic group |
Binary Variable (0-No, 1-Yes) |
± |
|
MACTI |
Main activity |
Categorical Variable |
± |
|
CHACT |
Change of activity |
Binary variable (0-No, 1-Yes) |
+ |
|
VINCOM |
Part of income from agriculture |
Continuous variable |
± |
|
NbreActif |
Number of farm workers |
Continuous variable |
+ |
|
ACTER |
Land access |
Binary variable (0-No, 1-Yes) |
+ |
TABLE 1 Description of variables determining crop choices
Descriptive statistics for qualitative variables
The table above shows the percentage distribution of the different modalities for each of the categorical variables, as well as the results of the chi-squared test to assess the association between these variables and study environments. In terms of socio-demographic characteristics, most of the respondents were men (91.33%), with a significant difference between the two communes. In fact, inheritance is patrilineal in these communities. As a result, farmland is under their control and they are also the heads of the families and therefore more involved in agriculture. Christianity is the dominant religion (64.83%), followed by Islam (30.17%) and animism (5.00%), justifying the predominance of Christians in the Atacora department. The dominant ethnic group is Berba (48.83%), followed by Wama (24.33%) and Gourmantche (19.17%). This justifies the historical predominance of this socio ethnic group going back many years. As for marital status, almost all respondents are married, with 55.33% in a monogamous union and 35.17% in a polygamous marriage. Furthermore, in terms of economic activities, all respondents have farming as their main activity and this is based on a mode of access to land that is mostly inheritance (71.50%), which differs very significantly between the two Communes (p<0.001) [26]. These differ in terms of investments, crops and even access to inputs and markets. A majority of respondents (65.50%) belong to an organization and 73.67% have access to credit, with a very marked difference between the two communes (p<0.001). The presence and distribution of microfinance institutions and savings and credit cooperatives varies from one commune to another. Material has seen a greater presence in this respect, thanks to the presence of several microfinance institutions in recent years and the intervention of projects that also grant credit (Tables 2 and 3).
| Variables | Modality | Material | Frequencies in % Tanguieta | All | Chi2 (p) |
| Sex | Female | 11,00 | 6,33 | 8,67 | 4,12 (0,04) |
| Male | 89,00 | 93,67 | 91,33 | ||
| Religion | Christian | 86,33 | 43,33 | 64,83 | 125,80 (0,00) |
| Muslim | 10,00 | 50,33 | 30,17 | ||
| Animist | 3,67 | 6,33 | 5,00 | ||
| Matrimonial status | Single | 7,33 | 7,00 | 7,17 | 173,02 (0,00) |
| Married-monogamous | 80,00 | 30,67 | 55,33 | ||
| Married-polygamous | 10,33 | 60,00 | 35,17 | ||
| Free union | 0,00 | 0,33 | 0,17 | ||
| Divorced | 1,33 | 0,67 | 1,00 | ||
| Widow | 1,00 | 1,33 | 1,17 | ||
| Main activity | Agriculture | 100,00 | 97,33 | 98,67 | 8,10 (0,04) |
| Breeding | 0,00 | 0,33 | 0,17 | ||
| Trade | 0,00 | 0,67 | 0,33 | ||
| Civil servant | 0,00 | 1,67 | 0,83 | ||
| Land access mode | Inheritance | 50,33 | 92,67 | 71,50 | 165,45 (0,00) |
| grant/donation | 6,00 | 0,33 | 3,17 | ||
| Rental | 40,67 | 1,67 | 21,17 | ||
| Purchase | 1,00 | 0,33 | 0,67 | ||
| Donation | 2,00 | 5,00 | 3,50 | ||
| Organisation membership | Yes | 82,00 | 49,00 | 65,50 | 72,28 (0,00) |
| No | 18,00 | 51,00 | 34,50 | ||
| Access to credit | Yes | 92,67 | 54,67 | 73,67 | 111,65 (0,00) |
| No | 7,33 | 45,33 | 26,33 | ||
| Ethnic group | Berba | 97,67 | 0,00 | 48,83 | 587,14 (0,00) |
| Nateni | 0,33 | 0,00 | 0,17 | ||
| Wama | 0,00 | 48,67 | 24,33 | ||
| Betamari | 0,00 | 7,33 | 3,67 | ||
| Gourmantche | 0,33 | 38,00 | 19,17 | ||
| Dendi | 0,00 | 0,33 | 0,17 | ||
| Biali | 1,67 | 1,33 | 1,50 | ||
| Other | 0,00 | 4,33 | 2,17 | ||
| Education level | No formal education | 84,67 | 40,67 | 62,67 | 125,36 (0,00) |
| Primary | 13,33 | 47,33 | 30,33 | ||
| Secondary | 1,00 | 8,33 | 4,67 | ||
| University | 1,00 | 3,67 | 2,33 |
TABLE 2 Statistics for qualitative variables
| Variables | Materials | Tanguieta | All | t (chi2) | |||
| Mean | Standard deviation | Mean | Standard deviation | Mean | Standard deviation | ||
| Age of respondant | 40,07 | 8,97 | 34,63 | 7,99 | 37,35 | 8,91 | 7,84 (0,00) |
| Experience in Agriculture | 12,46 | 5,61 | 13,97 | 7,40 | 13,22 | 6,60 | -2,80 (0,00) |
| Available farm size | 4,87 | 2,03 | 5,81 | 3,28 | 5,34 | 2,77 | -4,19 (0,00) |
| Cultivated farm size | 4,54 | 1,99 | 5,50 | 2,93 | 5,02 | 2,55 | -4,71 (0,00) |
| Household size | 9,52 | 3,24 | 10,02 | 5,37 | 9,77 | 4,44 | -1,38 (0,08) |
| Workers in the household | 6,74 | 3,17 | 8,34 | 4,63 | 7,54 | 4,05 | -4,94 (0,00) |
| Amount of credit obtained | 153636,4 | 100737,5 | 404852,9 | 288613,5 | 369873,4 | 283892,4 | -4,94 (0,00) |
TABLE 3 Statistics for quantitative variables
Table 2 provides a statistical summary of the quantitative variables. It shows that the results differ significantly overall for respondents in the two Communes around the Reserve. In terms of age, the average is 37 years (± 8.91), with 13 years (± 6.60) of farming experience. The average area of farmland available (5.34 hectares) for an average cultivated area of 5.02 hectares. This shows a shortage of land, since most producers claim to be land-poor and farm their entire available holding. It also shows that fallowing is becoming more common in this area, as families are more focused on their subsistence objectives. On average, each household has around 8 active members for farming activities and this number reiterates the capacity of households to sow in terms of labor and the shortage of farmland. The people living around the reserve have the possibility of obtaining a loan of 369,873.4 CFA francs, which enables them to cover their investment needs in some cases and more specifically in agricultural activities. It should be noted that the differences observed between the communes are significant at the 1% threshold, except for household size, which is significant at 10% between the two communes (p=0.08). These results highlight the socio economic and agricultural disparities between the two communes, which should be taken into account when designing appropriate interventions to support local communities. The two communes have uneven stages of economic development, with different economic activities despite both being around the same biosphere reserve. This may be due to the influence of neighboring communes and to governance in each commune [27-30].
Choice of main crops around the Pendjari biosphere reserve
The results in Table 4 show diversity in the proportion of farmers and average area devoted to different crops. Maize is the most widely grown crop in the study area with 68.4% of farmers, followed by soybeans with 67.1% and rice with 61.2%. In contrast, cassava and cowpea are the least cultivated, with only 6.7% of farmers each. In terms of average acreage, cotton occupies the largest area with 2.216 hectares per farmer, followed by maize (1.7034 ha), soybeans (1.4037 ha) and sesame (1.3875). Crops such as cassava and groundnuts have the smallest average areas, at 0.875 and 0.7878 hectares respectively. These data indicate that some crops, such as cotton, maize and soya, are oriented towards larger-scale production, probably for wider markets, while others, such as cassava and cowpea, are grown more intensively on smaller plots, potentially for local markets or self-consumption [31-35].
| Crops | Proportion of farmers practicing (%) | Average area (ha) |
| Cotton | 50,1 | 2,216 |
| Maize | 68,4 | 17,034 |
| Soybean | 67,1 | 14,037 |
| Sesame | 22,26 | 13,875 |
| Sorghum/Millet | 35,4 | 10,596 |
| Rice | 61,2 | 10,327 |
| Cassava | 6,7 | 0,875 |
| Beans | 6,7 | 0,7988 |
| Peanut | 31,9 | 0,7878 |
| Yam | 10,6 | 0,7852 |
TABLE 4 Proportion and average area of crops produced
Cultural choices around the Pendjari reserve
The results of the multinomial logit model presented in Table 5 indicate the determinants of crop choice, with cotton as the basic result [36].
|
Variable |
Maize |
Soybean |
Sesame |
|||
|
Coef |
dxdy |
Coef |
dxdy |
Coef |
dxdy |
|
|
NbreActif |
-0,001 |
0,003 |
-0,083* |
-0,008 |
-0,135 |
-3,19E-12 |
|
LEDUC |
0,398* |
0,066 |
0,702*** |
0,048 |
0,573 |
8,38E-12 |
|
EXP |
0,039* |
0,009 |
0,004 |
-0,001 |
0,126*** |
2,77E-12 |
|
OBTENC |
-0,898** |
-0,190 |
-0,671 |
-0,023 |
-14,174 |
-3,48E-10 |
|
AOG |
-1,865*** |
-0,410 |
-1,041*** |
-0,014 |
-2,692*** |
-4,54E-11 |
|
RCVA |
-1,202*** |
-0,270 |
-0,548 |
0,002 |
-0,057 |
1,3E-11 |
|
MACT |
0,051 |
0,020 |
-0,178 |
-0,019 |
-0,077 |
-2,04E-12 |
|
BPPROD |
0,050 |
0,012 |
0,015 |
-0,001 |
0,029 |
1,51E-13 |
|
ETHNIQUE |
0,000 |
0,000 |
0,000 |
0,000 |
-0,648** |
-1,65E-11 |
|
TNFEDUC |
0,325 |
0,061 |
0,419 |
0,025 |
-13,984 |
-3,6E-10 |
|
MARITE |
0,074 |
0,011 |
0,161 |
0,012 |
0,416 |
9,32E-12 |
|
MACTI |
-0,031 |
0,399 |
-9,154 |
-0,853 |
-3,517 |
-6,47E-11 |
|
CHACT |
-0,689 |
-0,087 |
-1,835* |
-0,141 |
-14,812 |
-3,64E-10 |
|
VINCOM |
-0,006 |
-0,002 |
0,010 |
0,001 |
0,009 |
2,74E-13 |
|
ACTER |
-0,935*** |
-0,234 |
0,118 |
0,053 |
-0,879 |
-1,25E-11 |
|
_cons |
1,410 |
9,481 |
2,804 |
|||
|
Note: LR chi2(48)=286.96; Prob>chi2=0.0000, Log likelihood=-508.19004; Pseudo R2=0.2202 |
||||||
TABLE 5 Determinants of cultivation choices around the Pendjari reserve
For maize, the number of active members in the household has a negative and significant effect, suggesting that households with more active labor are less likely to choose maize over cotton. Farmers prefer less labor intensive crops when they have few active members in the household. This includes food crops. For some, the labor available helps them to minimize labor costs and make a profit without using chemical pesticides on cotton, which leads them much more towards this crop, as they can better reconcile the challenges of protecting the biosphere. However, the respondent's level of education and farming experience have a significant positive influence, indicating that the most educated and experienced farmers are more likely to grow maize than cotton. They are better informed about new crop varieties and soil management techniques. In addition, these farmers assess the opportunity cost of each crop and, above all, are aware of the difficulties of growing cotton and the unfavorable level of fertility in the absence of chemical fertilizers and pesticides [37-48]. They therefore prefer to concentrate on less demanding crops, while promoting access to food products for their community in general and their household in particular. Obtaining credit and belonging to an organization have a negative and significant effect, indicating that access to credit and belonging to a group encourage farmers to give priority to cotton production over maize. Most of them belong to cotton producer groups and benefit from credit from the latter. This justifies their choice of cotton.
The choice of soybean cultivation is influenced by four variables. The number of employees has a negative influence on the adoption of soybean cultivation. An increase in the number of assets in the household reduces the probability of choosing soy over cotton. Producers with a large workforce are much more likely to grow cotton, as it is better organized and easier to access the market. This enables them to pay laborers for those who take them on. In addition, the level of education significantly and positively influences the choice of soybean over cotton at the 1% threshold. Educated farmers are more aware of soybean's properties as a legume that can boost the productivity of other crops, in this case cereals. They try to maintain the fertility of the small areas at their disposal in order to continue producing. Moreover, membership of an organization has a negative influence on the choice of soybean crops, indicating a low probability of choosing soybeans. The most frequent organizations are those of the cotton sector. In order to have access to inputs, they engage in this activity [49-55]. This justifies the negative influence of this variable on the adoption of soybean cultivation. Finally, a change of activity has a significant negative influence on the choice of soybeans. The more households engage in non-agricultural activities, the less likely they are to choose soybeans. Soybeans are time-consuming to maintain and harvest. Even the slightest carelessness can result in huge production losses.
As far as sesame is concerned, the respondent's level of education and farming experience have a positive and significant influence on the probability of choosing sesame over cotton. This can be explained by the fact that these variables confer on producers an awareness of the effects of cotton cultivation and, at the same time, the character of understanding and obedience to the biosphere's management bodies. Some of these farmers also believe that cotton is only profitable on a large scale and that access to land is limited. On the other hand, membership of an organization and the main activity of the household have a negative and significant effect on the choice of sesame over cotton. These are producers who take cotton and maize inputs for the season and are bound to a result for cotton, then use the fertilizers obtained for maize. For sesame, ethnicity and membership of an organization have a negative and significant effect on the probability of choosing sesame over cotton. On the other hand, experience improves the probability of growing sesame rather than cotton [56].
Historically, people living near the biosphere reserve were only allowed to grow staple crops, in order to preserve the biodiversity surrounding the biosphere reserve. This led to the predominance of men in this study, which reflects the traditional patterns of division of agricultural labor in many regions, where men are often the main decision-makers and managers of farming activities. However, the role of women in agriculture should not be underestimated, as they often play a key role in food production and household food security. Women participate in field work, but their role is less prominent than that of men. Access to land mainly through inheritance underlines the importance of customary land tenure systems in this rural area. The average age of respondents corroborates the observations of Nago et al., who highlight the influence of fishermen's age in the Pendjari Biosphere Reserve fishery. Differences in farming experience also align with the findings of Mignouna, highlighting the role of human capital in production decisions. In terms of farm characteristics, the average available land size of 5.34 hectares and the cultivated area of 5.02 hectares corroborate the findings of Makate et al. and Midega et al., on the importance of land endowment in crop choice and the scarcity of land leading to the considerable reduction in available farmland areas [57]. The significant divergences observed between Communes probably reflect distinct levels of agricultural productivity and income. Overall, these descriptive results highlight the socio-economic and agricultural heterogeneity between the two communes. Manda, et al., in their study conducted in Malawi, highlighted significant differences between neighboring villages in terms of farm household characteristics, such as household size, education level of household head and access to productive assets. Similarly, Michler and Josephson, in their analysis of crop choices in Mozambique, observed marked differences between neighboring communities [58].
The hierarchy of crops in the study area reveals that cotton is the main crop in terms of area, followed by maize, soya and sesame. Assogba, et al., in their study of peasant strategies to control monkeys, showed that cotton is the main cash crop around the biosphere reserve. In the same vein, Kombienou found that cotton is the main cash crop in northwest Atacora. For respondents in the area, cotton gives them access to many other agricultural services. Consequently, they resort to this crop despite the restrictions governing the management of the reserve and the food security challenge facing producers. The results of this research corroborate with the literature on the main crops grown around the biosphere reserve. Mechanisms to reduce negative impacts in favor of biosphere conservation are conceivable. The results of the analysis of the determinants of crop choice in this study align with the wider literature of factors influencing agricultural decision-making in developing countries. The significant effect of household socio-demographic variables, such as the number of active members on crop choice is in line with work. They showed that the availability of family labor is a major determinant of crop choices as well as the technologies adopted by small-scale producers. The positive influence of the producer's level of education and farming experience on the likelihood of choosing maize and sorghum over cotton corroborates the findings of numerous studies showing the interest of this category in the conservation of reserve resources advocated by the management body. These studies highlighted that producers' farming experience, measured by the number of years in practice, had a significant positive impact on the adoption of sustainable natural resource management techniques, such as crop rotation and the use of organic fertilizers. The negative effect of access to credit and group membership on the choice of maize over cotton aligns with the work of Awotide, et al., who found that access to credit can lead to a greater preference for cash crops, as they are often perceived as more profitable. Moreover, cotton benefits from particular attention in this sense. The role of ethnicity and the household's main economic activity in the choice of crops, as observed in the case of sesame, also show that traditions and cultural practices specific to each ethnic group shape agricultural decisions. Teklewold, et al., also showed that when a household had a non-agricultural activity as its main occupation, this reduced the likelihood of adopting food crops and gave priority to cash crops [59].
These results show that these residents’ populations are more aligned with crops that bring in more resources, which is contrary to the objective of authorizing production around the reserve. These income seeking populations are adopting more cash crops that provide them with income and this is what is increasing pressure on the land. This change in behavior, driven by market dynamics rather than subsistence needs, contributes to increased pressure on the land [60,61]. In this way, economic motivations are gradually taking precedence over the conservation objectives that had justified the controlled opening up of agricultural production in this sensitive area.
Farmers living around the Pendjari biosphere reserve are faced with the challenges of conserving and protecting the reserve, while at the same time responding to the growing land shortage and food needs of their community. As a result, they must combine innovative strategies for a better choice of crops, each according to their own production objectives. These strategies judiciously involve both extrinsic and intrinsic characteristics of the producers. This study showed that cotton is the main crop in terms of area under sowing, followed by maize, soybeans and sesame. Several variables significantly influence the choice of other crops relative to the reference crop, cotton. These include the number of active members in the household, level of education, experience in agriculture, obtaining credit, membership of an organization, change of activity, main activity of the household and ethnicity of the producer. Producers with an understanding of the stakes involved in conserving and protecting the biosphere opt much more for food crops, while other producers prefer cotton for its organization and easy access to inputs. These findings will provide guidance to rural development stakeholders on the main elements of crop selection and on the factors to be prioritized in the design of solutions adapted to farming around biosphere reserves and to the best management of the latter. By reconciling the imperatives of economic profitability, food demand and biodiversity preservation, these results will help to promote sustainable agriculture around protected areas.
[Crossref] [Google Scholar] [PubMed]
[Crossref] [Google Scholar] [PubMed]
[Crossref] [Google Scholar] [PubMed]
[Crossref] [Google Scholar] [PubMed]
Received: 14-Jul-2025, Manuscript No. AGBIR-25-167850; , Pre QC No. AGBIR-25-167850 (PQ); Editor assigned: 17-Jul-2025, Pre QC No. AGBIR-25-167850 (PQ); Reviewed: 01-Aug-2025, QC No. AGBIR-25-167850; Revised: 28-Aug-2025, Manuscript No. AGBIR-25-167850 (R); Published: 26-Sep-2025, DOI: 10.37532/0970-1907.25.41(1):1-9


