An International Journal
Agricultural and Biological Research
ISSN - 0970-1907
RNI # 24/103/2012-R1
RNI # 24/103/2012-R1
Research Article - (2024) Volume 40, Issue 2
Wheat (Triticum aestivum L.) is an important cereal crop that is cultivated worldwide and is one of the first crops to have been domesticated by human. The knowledge on traits contribution for total variation and genetic divergence of genotypes is essential for breeding program. Hence, the research was conducted at Kulumsa in 2022 to identify traits that contributed more to the total phenotypic variation and to cluster genotypes into genetically divergent groups and estimate the genetic distance between clusters of bread wheat genotypes. A total of 64 bread wheat genotypes were evaluated for 16 traits in 8*8 simple lattice design. The first four principal components accounted 76.76% of the total observed phenotypic variation with Eigen value greater than one. Cluster analysis classified the 64 bread wheat genotypes into five distinct clusters. The inter cluster distance between cluster I and cluster III, cluster IV and between cluster II and cluster III showed significant (P ≤ 0.05) and other cluster combination values had highly significant (P ≤ 0.01) compared with tabulated chi-square value and all inter cluster distances greater than intra cluster distances. The maximum inter cluster distance observed between cluster II and V followed by cluster III and V. Therefore, crossing genotypes between these clusters could result better genetic recombinant.
Cluster; Principal component analysis; Triticum aestivum; Yield related traits
Wheat is an important cereal crop that is cultivated worldwide and was one of the first crops to be domesticated about 10000 years ago [1]. World wheat production is based almost entirely on two modern species: common or hexaploid bread wheat (Triticum aestivum L, 2n=6x=42, AABBDD) and durum or tetraploid wheat (T. turgidum subsp. durum, 2n=4x=28, AABB). Bread wheat (Triticum aestivum L.) belongs to the family Gramineae and a monoecious plant with perfect flowers, it is reproducing sexually as an autogamous crop although limited (3%) cross pollination is possible [2].
Wheat is one of the most important cereal crops in Ethiopia and is produced across a large area of the country [3,4]. Wheat production in Ethiopia for 2021/2022 is projected to 5.18 million tons, up by 1.6 percent over the 2020/2021 production estimated. This is due to more Government of Ethiopia engagement in irrigation, better input supply and mechanized farming in the lowland and central parts of the country [5]. However, wheat production and productivity is relatively small compare to the global productivity. The main reason is that mostly subsistence farming of wheat is produced by small-scale farmers through rain feed production system with less irrigated production and constrained by several infectious diseases including rust and septoria leaf blotch diseases which are the major problem of wheat production in Ethiopia [3,6-8].
Genetic relationships among and with breeding materials can be identified and classified using multivariate grouping methods, for classifying breeding materials into distinct and variable groups depending on genotype performance [9]. Cluster analysis is one of the most common and efficient methods of multivariate statistical analysis for grouping genotypes. Wards method is among the most common methods in cluster analysis [10]. The clustering of individuals should then exhibit internal (within the cluster) homogeneity and high external (between clusters) heterogeneity, thus, if the classification is successful, individuals within a cluster shall be closer when plotted geometrically and different clusters shall be farther apart.
Genetic distance is defined as the difference between two entities that can be described by allelic variation [11]. Mahalanobis generalized distances approach, adopting, multiple measurements provided a measure of the generalized distance [12]. This method of measurement was important for the identification of genetically divergent genotypes to facilitate the grouping and characterization of agronomic and morphological characteristics [13]. Moreover, such studies also permitted the choice of genetically divergent parents to obtain desirable recombinants in segregating generations.
Principal Component Analysis (PCA) reflects the importance of the largest contributor to the total variation at each axis of differentiation [14]. The Eigen values are often used to determine how many factors to retain for possible variation present in the data set. The sum of the Eigen values is usually equal to the number of variables. The central idea of principal component analysis is to reduce the dimensionality of a data set consisting of a large number of interrelated variables, while retaining as much as possible of the variation present in the data set. Hence the research was conducted to identify traits that contributed more to the total phenotypic variation and to cluster genotypes into genetically divergent groups and estimate the genetic distance between clusters of bread wheat genotypes.
Experimental site
The research was conducted at Kulumsa agricultural research center main station in 2022 main cropping season. The experimental site is located at 08°01'10"N longitude and 39°09'11"E latitude at an altitude of 2200 meters above sea level. The mean annual rain fall of the site is 820 mm with an average annual temperature of 16.5°C.
Experimental materials
The 64 introduced bread wheat genotypes from International Maize and Wheat Improvement Center (CIMMYT) and International Center for Agricultural Research in Dry Areas (ICARDA) were randomly selected for study.
Experimental design and field management
The experiment was laid out in an 8 × 8 simple lattice design with two replications; the replication containing with eight incomplete blocks each containing eight genotypes were sown on a plot of (3 m²) consisting of 6 rows, each 2.5 m long; the spacing between rows was 20 cm. Spacing between plots and replications was 1 m and 1.5 m respectively. The seed rate was adjusted to 150 kg/ha. Planting was done at the onset of rain in the main cropping season. The trial was conducted with the application of 121 kg/ha of NPS and 100 kg/ha of urea. All Nitrogen, Phosphorus and Sulfur (NPS) was applied at planting while urea was applied in split: half at the time of planting and the remaining half at tillering stage. In addition, weeding was carried out uniformly.
Data collected
Data was collected from the mean of ten sample plants for the characters like plant height, effective tillers per plant, tillers per plant and spikelets per spike, spike length, kernels per spike, head weight, yield per head, peduncle length and spike length. However, plot base data were collected for the characters such as days to heading and maturity, grain yield, harvest index, hectoliter weight, thousand kernels weight and above-ground biomass yield.
Data analysis
Cluster analysis:Cluster analysis was conducted following the agglomerative hierarchical clustering ward’s method, in order to categorize genotypes into different homogeneous groups using XLSTAT (XLSTAT, 2014). The number of the cluster was determined based on Statistical Analysis System (SAS) computer software dissimilarity technique. The dendrogram was built based on agglomerative hierarchical clustering ward’s method using XLSTAT (XLSTAT, 2014).
Distance analysis:Genetic distance analysis was computed based on Euclidian dissimilarity distance using XLSTAT2014 statistical software (XLSTAT, 2014).
D²ij = (xi − xj) s−1 (xi − xj) ……………. (1)
Where: D²ij = The distance between cases i and j
Xi and Xj = Vectors of the values of the variables for cases i and j
s−1 = The inverse of pooled variance-covariance matrix.
The average intra and inter cluster distances was calculated by formula of Singh et al., [15] using XLSTAT (XLSTAT, 2014).
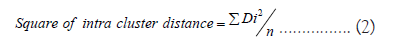
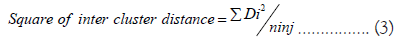
Where,
ΣDi²/n = Sum of distance b/n all possible combinations
ni = Number of genotypes in cluster i
nj = Number of genotypes in cluster j
Tests for significance of cluster distance was done both at 1% and 5% probability levels using chi-square (x²) distribution. D² values obtained for pairs of clusters were used as the calculated values and 'P' was a degree of freedom, where P is the number of traits considered [15].
Principal component analysis:The principal component analysis was done to identify the characters contributing more to the total variation using XLSTAT (XLSTAT, 2014). Only principal components with Eigen values greater than one are considered in this analysis according to [16]. Eigen vectors for that of Eigen values greater than one were considered as significance.
Clustering of genotypes
Cluster analysis was conducted following the agglomerative hierarchical clustering ward’s method, in order to categorize genotypes into different homogeneous groups. Cluster analysis classified the 64 bread wheat genotypes into five distinct clusters (Table 1 and Figure 1). This indicated the presence of diversity among the tested bread wheat genotypes. Cluster I was the largest cluster which consisted of 24 genotypes (37.5%) followed by cluster III contained 18 genotypes (28.1%), cluster II and cluster IV consisted of 14 (21.9%) and 5 (7.8%) genotypes respectively. While cluster V had the lowest number of genotypes that comprises 3 genotypes (4.7%).
| Cluster No | No of genotypes | Percentage (%) | Genotypes code |
|---|---|---|---|
| I | 24 | 37.5 | 1,6,9,11,13,14,18,22,23,26,29,31,32,35,36,49,50,51,52,53,56,59,61,63 |
| II | 14 | 21.9 | 3,16,20,21,25,34,39,43,44,47,54,55,60,62 |
| III | 18 | 28.1 | 2,4,5,7,8,10,12,17,24,27,30,33,37,41,45,46,48,64 |
| IV | 5 | 7.8 | 15,19,28,38,40 |
| V | 3 | 4.7 | 42,57,58 |
Table 1: Distribution of 64 bread wheat genotypes in to five different cluster groups.

Figure 1: Dendrogram of 64 bread wheat genotypes in to five different clusters.
Similarly clustering of wheat genotypes were studied by different researchers Zemede et al., [17] reported that 64 wheat genotypes grouped into five distinct clusters with cluster-I contain 7 genotypes, cluster-II contain 4 genotypes, cluster-III contain 35 genotypes cluster-IV contain 8 genotypes and cluster-V contain 10 genotypes. Gezahegn et al., [18] observed 64 genotypes were grouped into nine distinct clusters, Kumar et al., [19] also reported the 55 wheat genotypes were grouped into eight clusters and 50 wheat genotypes were grouped into eight clusters [20]. 127 wheat genotypes clustered into four distinct groups and 25 bread wheat genotypes clustered into four diverse groups [21,22].
Cluster mean analysis
The mean values of five clusters for 16 different traits revealed considerable differences among the clusters of 64 bread wheat genotypes (Table 2). For most traits genotypes grouped in cluster II had the maximum cluster mean values followed by genotypes assigned in cluster III, cluster I and cluster IV. While genotypes in cluster V characterized by minimum cluster mean values for all characters except days to maturity and number of tillers per plant. Thus the cluster mean analysis indicated that, genotypes in cluster II had the maximum value of days (67.54) to 50% heading, days (122.71) to 90% maturity, plant height (103.9 cm), number of kernel per spike (51.42), head weight (2.97 g), yield per head (2.07 g), biomass yield (16,846.20 kg/ha), grain yield (5,332.11 kg/ha), hectoliter weight (80.42), thousand kernel weight (39.42 g) and harvest index (32.04%) whereas, the second largest number for peduncle length and smallest number for number of tillers per plant.
| Traits | Cluster number | ||||
|---|---|---|---|---|---|
| I | II | III | IV | V | |
| DTH | 65.63 | 67.54 | 65.97 | 63.98 | 63.63 |
| DTM | 118.15 | 122.71 | 120.93 | 118.18 | 120.87 |
| PHT | 96.82 | 103.90 | 98.23 | 94.54 | 80.76 |
| NTPP | 4.00 | 3.88 | 4.17 | 4.08 | 3.90 |
| NETPP | 3.20 | 3.17 | 3.44 | 3.16 | 2.96 |
| NSPS | 18.50 | 18.22 | 18.85 | 18.34 | 16.80 |
| NKPS | 47.29 | 51.42 | 50.36 | 41.97 | 36.16 |
| PDL | 16.67 | 17.31 | 17.12 | 17.56 | 11.12 |
| SL | 8.39 | 8.42 | 8.60 | 8.53 | 7.40 |
| HW | 2.18 | 2.97 | 2.52 | 1.76 | 1.36 |
| YH | 1.48 | 2.07 | 1.69 | 0.99 | 0.64 |
| BY | 11240.10 | 16846.20 | 14219.31 | 9808.43 | 5767.00 |
| GY | 3324.21 | 5332.11 | 4232.4 | 1832.25 | 956.41 |
| HLW | 75.97 | 80.42 | 78.98 | 68.29 | 59.58 |
| TKW | 31.81 | 39.42 | 34.03 | 24.85 | 17.97 |
| HI | 29.73 | 32.04 | 29.97 | 18.78 | 16.38 |
Note: DTH: Days To Heading; DTM: Days To Maturity; PHT: Plant Height; NTPP: Number of Tillers Per Plant; NETPP: Number of Effective Tillers Per Plant; NSPS: Number of Spikelet Per Spike; NKPS: Number of Kernels Per Spike; PDL: Peduncle Length; SL: Spike Length; HW: Head Weight; YH: Yield per Head; BY: Biomass Yield; GY: Grain Yield; HLW: Hectoliter Weight; TKW: Thousand Kernel Weight; HI: Harvest Index.
Table 2: Mean values of five clusters for 16 characters of 64 bread wheat genotypes tested at Kulumsa in 2021/22 main cropping season.
Genotypes in cluster I measured the second largest number for number of effective tillers per plant and number of spikelets per spike and took the shortest days (118.15) to maturity and the rest characters ranked third next to genotypes in cluster II and cluster III by cluster mean values. Genotypes grouped in cluster III characterized by maximum number for traits such as number of tillers per plant (4.17), number of effective tillers per plant (3.44), number of spikelets per spike (18.85) and spike length (8.60 cm) and the rest traits ranked second next to cluster II except peduncle length. Genotypes grouped in cluster IV manifested the tallest peduncle length (17.56), the second largest number for number of tillers per plant and spike length and the rest characters were ranked second minimum number next to cluster V.
Gezahegn et al., [18] reported 64 bread wheat genotypes clustered in to nine clusters in which genotypes in cluster IX were characterized by late maturity (125.50 days), highest 1000 kernel weight (34.06 g/plot), highest grain yield (5,322.5 kg/ha) and highest biomass yield (18,945 kg/ha). Cluster I exhibited the lowest values of 1000 kernel weight (22.83 g) and it exhibited the highest values for number of grains per spike (42.60) and number of effective tillers per plant (4.58). Cluster V was characterized by the highest values of hectoliter weight (70.41) and harvest index (29.49). Cluster IV was characterized by highest value of days to 50% heading (67.25). Genotypes in cluster VII showed the highest spike length (9.04 cm). Adilova et al., [22] reported the cluster analysis revealed the classification of 25 accessions into four diverse groups. The maximum average values for grain yield (742.2 kg/ha), biomass (1756.7 kg/ha) and grains per spike (45.3) were higher in cluster III compared to other clusters. Cluster IV exhibited the maximum thousand-kernel weight (46.6) Zemede et al., [17] reported that 64 wheat genotypes grouped into five clusters in which the first cluster genotypes had highest in grain yield associated to high number of kernels and long spike. The second cluster genotypes produced relatively low grain yield and biomass yield. Ten genotypes were found in cluster V which had shortest in their height associated with low biomass yield and high harvest index.
Poudel et al., [20] studded 50 bread wheat genotypes clustered in to four groups in which cluster I genotypes having highest value of thousand kernel weight, plant height and grain yield, cluster 2 had the highest value of days to heading and lowest yield in comparison to other clusters. This cluster had shown moderate value of plant height, number of grains per spike and days to maturity. Cluster III showed moderate values for all traits and cluster IV genotypes had the highest number of grains per spike. The mean number of effective tillers per plant (14.89), number of spikelets per spike (22.20), spike length (11.49), number of grains per spike (73.67) and yield per plant (31.23) were highest in cluster I. The plant height (113.18) and 1000 grain weight (48.55) were maximum in cluster II.
Koshraj et al., [23] had clustered 30 genotypes into five clusters. Cluster I represented highest, plant height, spike length, peduncle length and yield per spike. Cluster II had highest grain yield and other yield attributing traits. Yadav et al., [24] clustered 50 wheat genotypes in to eight clusters in which cluster IV (119.75) is characterized by highest mean performance for days to 50 heading (96.50 days), days to maturity (134.50 days), spike length (12.38) and lowest for plant height (81.00) followed by cluster I with cluster mean values highest for plant height (95.90), cluster VIII with highest cluster mean values for thousand kernel weight (56.58 g), while cluster VI had highest cluster mean values for grains per spike (56.70) and remaining cluster VII, cluster II, cluster V and cluster III were characterized average mean values for all traits.
Analysis of inter and intra cluster distance
The results of intra and inter clusters distance analysis revealed that inter cluster distance between cluster I and cluster III, cluster IV and between cluster II and cluster III showed significant (p ≤ 0.05) and other cluster combination values had highly significant (p ≤ 0.01) compared with chi-square value and greater than all intra cluster distance (Table 3). Cluster V showed minimum intra cluster distance (D² = 10.54) followed by cluster I (D² = 13.09). The maximum intra cluster distances was obtained in cluster IV (D² = 16.78) followed by cluster II (D² = 15.61). The maximum inter cluster distance observed between cluster II and V (D² = 127.12) followed by cluster III and V (D² = 97.94), whereas, the smallest inter cluster distance was recorded in cluster I and IV (D² = 26.32) followed by cluster II and cluster III (D² = 29.10) and cluster I and cluster III (D² = 31.68). It is distinguished that the greater the distance between clusters, the wider the genetic diversity would be between the genotypes. Thus, the largest inter-cluster distance indicates the existence of wide proximity between these clusters as compared with other clusters. Hence, crossing genotypes between these two clusters could result better genetic recombinant. The minimum inter-cluster distances had the lowest degree of divergence between clusters showed that the genotypes were relatively close to each other than genotypes grouped in other clusters. This indicated that the existence of closer proximity between these clusters as compared with other clusters. Consequently, crossing genotypes between these two clusters could result poor genetic recombinant and is not advisable [25].
| Cluster no | 1 | 2 | 3 | 4 | 5 |
|---|---|---|---|---|---|
| 1 | 13.09 | 61.00** | 31.68* | 26.32* | 68.00** |
| 2 | - | 15.61 | 29.77* | 83.22** | 127.12** |
| 3 | - | - | 13.97 | 54.25** | 97.94** |
| 4 | - | - | - | 16.78 | 45.99** |
| 5 | - | - | - | - | 10.54 |
Note: (*): Significant at (5%) was 26.30; (**): Highly significant at (1%) was 32.0 probability levels respectively.
Table 3: Intra (bold diagonal) cluster distance and Inter (off bold) cluster distance of 64 bread wheat genotypes in to five different clusters.
Gezahegn et al., [18] reported 64 bread wheat genotypes clustered in to nine clusters in which maximum inter cluster distance was observed between cluster I and IX (D² = 5112.1), followed by that between clusters III and IX (D² = 4694.4) and VIII and IX (D² = 3871.9) which had shown they were genetically more divergent from each other than any other clusters. Crosses between genotypes selected from cluster I with cluster IX, cluster III with cluster IX and cluster VIII with cluster IX are expected to produce relatively better genetic recombination and segregation in their progenies. And 55 wheat genotypes clustered into eight different clusters in which the maximum inter cluster distance was observed between cluster VI and cluster VIII followed by cluster VI and VI which exhibited high degree of genetic diversity. The minimum intra cluster distance was observed within cluster VI and cluster III followed by cluster I and VIII, which exhibited less genetic diversity and thus may be utilized under population improvement of wheat genotypes.
Thirty wheat genotypes clustered into seven clusters in which the maximum intra cluster distance observed in cluster III (162.58) followed by cluster II (102.15) and minimum in cluster IV-VII and maximum inter cluster distance found between cluster VI and VII (D² = 1627.88) followed by cluster V and cluster VII (D² = 1270.68) and between cluster IV and VI (D² = 943.23) and significant difference observed between all inter cluster distances [25]. Crossing between genotypes from this significant inter clusters distance will be enhancing the yield and chances of getting better recombinants in segregating generations might be utilized in hybridization in wheat breeding program [18,22,23].
Principal component analysis
The results of principal component analysis for sixteen traits of 64 bread wheat genotypes are presented in Table 4 and Figure 2 bi plot. The first four Principal Components (PCs) accounted 76.76% of the total observed variation. Among the five principal components the first Principal Component (PC) contributed for 42.55% of the total variation, this was due to the positive loading effect of all studied traits mainly plant height (0.28), number of kernel per spike (0.25), head weight (0.33), yield per head (0.36), biomass yield (0.32), grain yield (0.35), hectolitre weight (0.34), thousand kernel weight (0.33) and harvest index (0.29). The second principal component shared about 14.69% of the total variation and the major positively contributing characters were days to heading (0.45), days to maturity (0.38), number of spikelet per spike (0.31), number of kernel per spike (0.23), spike length (0.10) and head weight (0.09). Whereas, all the rest traits were observed negative loading effect, among these number of tillers per plant (-0.37), number of effective tillers per plant (-0.41), peduncle length (-0.36) and thousand kernel weight (-0.18) had highest negative loading effect in PC II.
| Eigen vectors | ||||
|---|---|---|---|---|
| Traits | PC1 | PC2 | PC3 | PC4 |
| DTH | 0.11 | 0.451 | 0.324 | -0.284 |
| DTM | 0.119 | 0.375 | 0.252 | -0.366 |
| PHT | 0.278 | -0.109 | 0.154 | 0.076 |
| NTPP | 0.011 | -0.37 | 0.549 | -0.149 |
| NETPP | 0.05 | -0.411 | 0.504 | -0.132 |
| NSPS | 0.142 | 0.31 | 0.337 | 0.438 |
| NKPS | 0.249 | 0.227 | -0.012 | 0.109 |
| PDL | 0.143 | -0.358 | -0.051 | 0.286 |
| SL | 0.133 | 0.102 | 0.252 | 0.608 |
| HW | 0.329 | 0.09 | -0.064 | 0.1 |
| YH | 0.358 | -0.025 | -0.102 | -0.027 |
| BY | 0.322 | -0.042 | -0.048 | -0.194 |
| GY | 0.353 | -0.041 | -0.112 | -0.141 |
| HLW | 0.335 | -0.043 | -0.019 | -0.089 |
| TKW | 0.333 | -0.182 | -0.142 | -0.092 |
| HI | 0.292 | -0.069 | -0.151 | 0.004 |
| Eigen value | 6.807 | 2.35 | 1.756 | 1.368 |
| Proportion (%) | 42.545 | 14.689 | 10.976 | 8.552 |
| Cumulative (%) | 42.545 | 57.234 | 68.21 | 76.762 |
Note: DTH: Days To Heading; DTM: Days To Maturity; PHT: Plant Height; NTPP: Number of Tillers Per Plant; NETPP: Number of Effective Tillers Per Plant; NSPS: Number of Spikelet Per Spike; NKPS: Number of Kernels Per Spike; PDL: Peduncle Length; SL: Spike Length; HW: Head Weight; YH: Yield per Head; BY: Biomass Yield; GY: Grain Yield; HLW: Hectoliter Weight; TKW: Thousand Kernel Weight; HI: Harvest Index; PC: Principal Component.
Table 4: Principal component analysis of sixteen traits of four components of 64 bread wheat genotypes evaluated at Kulumsa agricultural research center in 2022.

Figure 2: Bi-plot of 64 bread wheat genotypes with 16 traits for PC1 and PC2; Note: PC: Principal Component
The third principal component had proportion variability of 10.98% from the total variation. The main positive loading effect of days to heading (0.32), days to maturity (0.25), plant height (0.15), number of tillers per plant (0.55), number of effective tillers per plant (0.50), number of spikelet per spike (0.34) and spike length (0.25), while the rest traits had negative loading effect to PC III. The fourth principal component accounted for 8.55% from the total variation. variation was chiefly attributed due to number of spikelet per spike (0.44), number of kernel per spike (0.11), spike length (0.61) and peduncle length (0.29) and days to maturity (-0.37) followed by days to heading (-0.28) had highest negative loading effect for PC IV [26].
Wani et al., [27] studied on twenty-four bread wheat genotypes for principal component analysis the first three principal components based on the euclidean similarity matrix explained 76.67 percent of the total variation and had Eigen value greater than one (Eigen value<1) which is PC 1, PC 2 and PC 3 had Eigen value of 12.32, 1.25 and 1.03 respectively. It is revealed that days to heading, biological yield and grain yield contribute significantly to the quantum of variation as explained by principal component 1 and it was further observed that days to maturity, plant height and thousand grain weight are the main components of the PCA 2.
Gezahegn et al., [18] reported for six principal components having Eigen value greater than one (significant), accounted 77.20% of the total phenotypic variation. Characters having relatively higher value in the principal component like grain yield, harvest index, thousand kernel weight and hectoliter weight. Variation in second principal component was chiefly due to days to 50% heading, followed by days to maturity, number of productive tillers. Traits such as plant height, biomass yield per plot and spike length were the major contributors of variation in the third principal component. Variation in the fourth principal component was mainly due to number of spikelets per spike, number of productive tillers per plant, days to maturity. Characters having relatively higher value in the principal component 5 like plant height, biomass yield, number of spikelets per spike and grain yield had more contribution to the total variation.
Kumar et al., [19] study on principal component analysis the first six principal components showed Eigen values more than one and explained 81.75% variability. The first principal component explained 20.83% of the total variation and the second and third principal components explained 19.428% and 10.39% variation, respectively. And Beheshtizadeh et al., [28] had studied on principal component analysis indicated that only four first components, which account for 76% of the total variance are important. The first principal component, which accounted for about 38% of the variation, was strongly associated with head weight, number of seed per spike, yield per spike. The second principal component, which accounted for about 15% of the total variation, consisted of days to tillering and plant height. The third principal component was positively correlated with thousand kernel weight and number tillers per plant accounted for 12% of the variation. The fourth principal component, accounted for 11% of the variation. In this component, correlation of yield per spike and its components were highly positive.
The results of principal component analysis showed the first four principal components accounted 76.76% of the total observed phenotypic variation with Eigen value greater than one. Among the four principal components the first principal component contributed for 42.55%, the second principal component shared about 14.69%, the third principal component had proportion variability of 10.98% and the fourth principal component accounted for 8.55% of the total observed variation.
Cluster analysis classified the 64 bread wheat genotypes into five distinct clusters contained 3-24 genotypes. This indicated the presence of diversity among the tested bread wheat genotypes. The results of intra and inter clusters distance analysis revealed that inter cluster distance between cluster I and cluster III, cluster IV and between cluster II and cluster III showed significant (P ≤ 0.05) and other cluster combination values had highly significant (P ≤ 0.01) compared with tabulated chi-square value and all inter cluster distances greater than intra cluster distances. The maximum inter cluster distance observed between cluster II and V followed by cluster III and V. Hence, crossing genotypes between these two clusters could result better genetic recombinant. Based on the result of inter cluster distances it is possible to cross genotypes from cluster II and V and genotypes from cluster III and V since the maximum and significant inter cluster distance observed between these clusters.
The authors would like to thank for the financial support provided by Ethiopian Institute of Agricultural Research and we are also grateful to Kulumsa Agricultural Research Center for its support in providing experimental materials and site to conduct this study.
[Crossref] [Google Scholar] [PubMed]
[Crossref] [Google Scholar] [PubMed]
[Crossref] [Google Scholar] [PubMed]
Citation: Zewdu D, Mekonnen F, Geleta N. Cluster and principal component analysis for yield and yield related traits of bread wheat (Triticum aestivum L.) genotypes. AGBIR.2024;40(2):962-967.
Received: 01-Jan-2024, Manuscript No. AGBIR-24-123116; , Pre QC No. AGBIR-24-123116 (PQ); Editor assigned: 03-Jan-2024, Pre QC No. AGBIR-24-123116 (PQ); Reviewed: 17-Jan-2024, QC No. AGBIR-24-123116; Revised: 26-Jan-2024, Manuscript No. AGBIR-24-123116 (R); Published: 05-Feb-2024, DOI: 10.35248/0970-1907.24.40.962-967
Copyright: This open-access article is distributed under the terms of the Creative Commons Attribution Non-Commercial License (CC BY-NC) (http:// creativecommons.org/licenses/by-nc/4.0/), which permits reuse, distribution and reproduction of the article, provided that the original work is properly cited and the reuse is restricted to noncommercial purposes. For commercial reuse, contact reprints@pulsus.com This is an open access article distributed under the terms of the Creative Commons Attribution License, which permits unrestricted use, distribution, and reproduction in any medium, provided the original work is properly cited.


