An International Journal
Agricultural and Biological Research
ISSN - 0970-1907
RNI # 24/103/2012-R1
RNI # 24/103/2012-R1
Research Article - (2024) Volume 40, Issue 2
Waterbodies play a fundamental role within the society, impacting various aspects of our lives. In an aquatic ecosystem, plankton diversity regulates the productivity of these waterbodies. The distribution patterns of plankton are closely associated with the distinct physicochemical attributes exhibited by each waterbody. This research aims to investigate the intricate relationships between physicochemical parameters and plankton distribution across diverse waterbodies encircling the Bankura district. The focal point of this study is to discern the correlations between physicochemical parameters and plankton distribution within the specified waterbodies. The comprehensive approach here involves the collection of both water and plankton samples, followed by a meticulous measurement of physicochemical parameters and plankton diversity, adhering to well-established methodologies. The sampling was done between August 2022 to May 2023. The study sites have been classified into two categories. Normal waterbodies and bloom forming waterbodies. Statistical methodologies are harnessed to find correlations and interdependencies. One-way Analysis of Variance (ANOVA) of all physicochemical parameters and zooplankton showed highly significant difference (p<0.05) between two categories of waterbodies. The results unveiled significant insights, particularly the notable Pearson’s correlation (p<0.05) between different physicochemical parameters and zooplankton group. Occasionally, waterbodies became enriched with nutrients (PO4-3-P, NO2--N), which subsequently trigger excessive plant growth, a phenomenon recognized as eutrophication, culminating in the formation of toxic red algal blooms. One potential causative agent behind these red blooms is Euglena sp., Several diversity indices are used to evaluate the abundance and species richness in the waterbodies. Water quality index of different study sites has been developed to find the status of the waterbodies. The current investigation strongly underscores the significant correlations that exist between the plankton diversity of the studied waterbodies and their underlying physicochemical attributes. This insight not only enhances our comprehension of the intricate dynamics within these ecosystems but also emphasizes the imperative role of physicochemical parameters influencing plankton distributions.
Water quality index; Zooplankton; Environmental sustainability; Euglena sp.; Eutrophication
Water encompasses a vital necessity and serves as the primal source of life. Approximately 71% of the Earth’s surface is covered by water, with an overwhelming 96.5% residing within the oceans. The remaining 3.5% takes diverse forms like water vapor in the atmosphere, liquid in rivers and lakes, solid in icecaps and glaciers and soil moisture in the ground. A mere 2% of this 3.5% stands as fresh water in surface and subsurface water bodies, rendering it suitable for both human consumption and aquaculture. However, there’s a growing concern over the declining quality of Indian water bodies due to continuous discharge of industrial, agricultural and domestic waste [1-3]. This predicament impacts both lotic and lentic inland water bodies, subjecting freshwater ecosystems to persistent environmental stresses. Waterbodies emerge as multifunctional assets, primarily as abundant sources of open freshwater. Within aquatic ecosystems, phytoplankton assumes a central role, constituting the main nutritional cycles. These microscopic organisms serve as primary food sources for a diverse array of organisms, ranging from fish to crustaceans and shellfish [4,5]. Abundance of phytoplankton and zooplankton also serve as indicators of trophic status of waterbody. Freshwater zooplankton bridges the gap between producers and primary consumers and sustaining the intricate ecological web. The distribution of these plankton groups and their abundance contributes to estimating a waterbody’s fishery potential [6]. Bankura, a district in West Bengal, India stands out for its remarkable pisciculture achievements. The main reason is attributed to a plethora of waterbodies, particularly ponds. However, the town's seasonal and shallow-water ponds face challenges of fluctuating water levels which ultimately impacts the fish production. It has been reported that seasonal variation of physicochemical and hydrobiological parameters of perennial and shallow- water ponds was also regulating the fish yield [7]. There are plenty of reports that show that zooplankton, particularly rotiferas, prove essential for fish organ growth, relying on phytoplankton as a nutrient source [8,9]. Algal blooms, known as the “flowering of the water”, influenced by various algal classes, which became a noteworthy phenomenon from 2018. These blooms, mainly attributed to Bacillariophyceae, Chlorophyceae, Cyanophyceae, Dinophyceae and Euglenophyceae, have prompted comprehensive physicochemical and plankton analyses. Recently the abnormal propagation of Euglena sp., a microalga rich in astaxanthin, impacting waterbodies worldwide [10]. High organic matter and Phosphate (P) concentrations were observed in ponds featuring euglenoid blooms [11]. Concurrently, harmful algal blooms, like red tide, emerged as environmental threats that primarily impacting coastal areas and aquatic ecosystems [12,13]. An abrupt and notably concentrated proliferation of algae, specifically Euglena sp., forming an extensive layer atop these shallow-water waterbodies. This phenomenon of heightened algal growth creating a floating bloom which significantly impacted the pisciculture activities in Bankura town. This algal bloom layer helps to induce oxygen depletion in those waterbodies and alters the dissolved oxygen and pH level significantly among perennial water bodies. However, the implications of these changes on waterbodies ecosystem, including physicochemical and hydrobiological alterations, remain uncharted. Additionally, the interplay between algal growth and fish yield warrants exploration, offering insights into the intricate relationship between these two variables. This may be a good prognostic marker for predicting the productivity of the waterbodies.
Study area
The water samples were collected from different static waterbodies and ponds throughout the Bankura district. These ponds are specifically tailored for fish culture, meticulously maintained by local farmers to ensure a standardized and conducive environment for fish cultivation. The Ramsagar zone, located approximately 30 km away from Bankura town, is renowned for its fishery activities and the ponds within this zone are well-preserved. They are primarily utilized for fish culture, with limited use for bathing and washing. Within the Ramsagar zone (Zone-1), various waterbodies were examined. Pond R-1 (Hatibari 1) is sizable and situated away from localities next to a poultry farm house, exhibiting a greenish water color. Pond R-2 (Hatibari 2), adjacent to R-1, shares a similar size, is well-maintained and displays a greenish water color. Pond R-3 (Sima bandh) is also impeccably maintained, devoid of weeds, regularly manicured and with water color not excessively greenish. All three ponds in this zone are strictly dedicated to fish culture and are managed by fish farmers. Pond R-4 (Hatibari 3) is comparatively smaller and serves regular purposes along with seasonal fish culture. Pond R-5 (Hadgora pukur) is large with a greenish-red water color, well maintained and situated within the locality. Pond R-6 (Rakshit Pukur) is similarly large, has greenish water and is situated locally. Ponds in this zone cater to local activities and to some extent, seasonal fish culture. Moving beyond the Ramsagar zone, the second zone (Zone-2) is situated in Bankura town, with ponds distributed throughout its south-eastern part. Six water collection sites (N-1, N-2, N-3, N-4, N-5 and N-6) were identified, including two nearer pond sites. N-1 and N-2 are ponds in the Police line area of Bankura. N-1 is within the Bankura Police line, while N-2, known as Tamblibandh pond is located next to the police line pond. N-3 pond is utilized by the general public for daily activities such as bathing, washing and fishing. N-3 and N- 4 ponds are located beside Shit Pukur lane, Kundupara, adjacent to each other in the township area. The last two ponds, namely N-5 (Rathtala area pond) and N-6 (Dol mandir area pond), are situated in the northern part of Bankura town within the township. All the ponds are enclosed by densely populated areas of Bankura.
Physicochemical parameters evaluation
To conduct the analysis of physicochemical parameters, Water samples were collected during the early morning hours, specifically between 6 to 8 AM, from each of twelve collection sites (Figure 1). This step was repeated several times in different days. Standard protocols as outlined by American Public Health Association (APHA), American Water Works Association (AWWA), Water Pollution Control Federation (WPCF) were followed to determine variables such as Dissolved Oxygen (DO), Free Carbon Dioxide (FC), Total Alkalinity (TA), Total Hardness (TH), Bicarbonate (HCO3-), Electrical Conductivity (EC), Chloride ions (Cl-) and nutrients like Phosphate-P (PO4-3), Nitrite (NO2-), Ammonium (NH4+). These values were then compared against the established norms set by the Bureau of Indian Standards (BIS). To test the surface Water Temperatures (WT), a Celsius thermometer featuring a scale spanning from 0°C to 100°C was employed. The pH of the water was directly measured using a digital electrode pH meter (Systronics, Model No. SYS-335). Throughout the experimental phase, chemicals employed were of the utmost purity available. Throughout the laboratory experiments, chemicals primarily sourced from Merck, India were employed for the analysis of physicochemical parameters.

Figure 1: Different study sites of Bankura district of West Bengal (R1 to R6 shows the bloom forming waterbodies while N1 to N6 shows normal water bodies) developed
with QGIS software.  .
.
Zooplankton collection and evaluation
The collection of zooplankton was carried out using a customized Heron Tranter net, incorporating a circular metallic frame spanning an area of 0.625 sq.m. For the collection process, a nylon bolting silk plankton net with a mesh size of 25 (50 µ) was utilized, forming the filtering cone of the apparatus. The zooplankton samples were gathered and subsequently transferred to appropriately labelled vials containing 5% formalin and samples was placed under the counter. The observation and documentation of plankton were facilitated through the utilization of a Magnus trinocular microscope (Model-MLX TR) coupled with a Nikon Coolpix Camera. For the meticulous taxonomic identification process, previous studies were diligently followed as references. Quantitative analysis was conducted using a Sedgwick Rafter counter [14]. The chemicals used were of the highest available purity or were of analytical Analytical Reagent (AR) grade. After collecting the data, different diversity indices were calculated using standard formulas [15].
Dominance (D) index was calculated by using the formula:
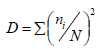
where ni is the abundance of the ith taxon and N is the total abundance of all taxa.
The Simpson’s diversity index (1-D) was calculated by using the formula:

Shannon-Wiener diversity index (H) was calculated by using the formula:
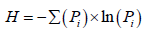
where Pi= ni/N
Menhinick's index was calculated by using the formula:
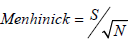
where S is the taxa richness and N is the total abundance.
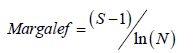
Margalef’s diversity index was calculated by using the formula:
Equitability index (J) was calculated by using the formula:

Berger-Parker index was calculated by using the formula:
where nmax is the abundance of the most abundant taxon.
Species evenness was calculated by using the formula
The water quality index
The Water Quality Index (WQI) has been assessed based on the drinking water quality standards recommended by the Bureau of Indian Standards (BIS). The calculation of the WQI employs the weighted arithmetic method, initially introduced by Horton [16] and further refined by Brown et al., [17]. The weighted arithmetic WQI is expressed as follows:
Where ‘n’ representing the number of variables or parameters, Wi denoting the unit weight for the ith parameter and Qi representing the quality rating (sub-index) of the ith water quality parameter. The unit weight (Wi) assigned to each water quality parameter is inversely proportional to the recommended standards established for the respective parameters. This weighting scheme ensures that greater significance is attributed to deviations from recommended standards in the calculation of the overall water quality index.
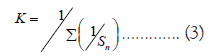
where, Wi=Unit weight for the ith parameter, Sn= Standard value for ith parameters, K=Proportional constant, the value of K has been considered ‘1’ here and is calculated using the mentioned equation below:
According to Brown et al., [17], the value of quality rating or sub-index (Qi) is calculated using the equation as given below:
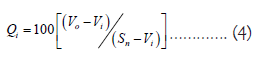
In the calculation of the WQI, the observed value (Vo) of the ith parameter at a given sampling site is compared to the ideal value (Vi) and the standard permissible value (Sn). For drinking water, all ideal values (Vi) are considered zero, except for pH and dissolved oxygen, where the ideal values are 7.0 and 14.6 mg/L, respectively. The permissible value for pH in polluted water is 8.5 and for dissolved oxygen in drinking water, it is 5 mg/L.
The quality rating (Q) for pH and dissolved oxygen is determined using the following equations:


where, VpH=Observed value of pH, VDO=Observed value of dissolved oxygen. If, Qi=0 implies complete absence of contaminants while 0<Qi<100 implies that, the contaminants are within the prescribed standard. When Qi>100 implies that, the contaminants are above the standards. The classification of water quality based on the water quality index, following the criteria by Brown et al., [17] and Chatterjee and Raziuddin [18] is presented in Table 1 for reference in this study.
| Water quality index | Rating class |
|---|---|
| 0-25 | Excellent |
| 26-50 | Good |
| 51-75 | Poor |
| 76-100 | Very Poor |
| >100 | Unsuitable |
Table 1: Classification of water quality and status based on weighted arithmetic water quality index Method.
Statistical analysis
In the realm of aquatic ecology, the journey from raw data to illuminating insights is a meticulous process that spans data acquisition, statistical exploration and graphical representation. This paper delves into the systematic approach employed in the acquisition and processing of data. The foundation of this study depends on the acquisition of data from various aquatic environments. Using Microsoft Excel 2016, a structured data sheet was meticulously prepared, capturing a diverse array of physicochemical parameters and zooplankton diversity metrics. Distributions of variables are represented by box-plots. One-way Analysis of Variance (ANOVA) was employed to ascertain if significant differences existed between various waterbodies, offering a window into the heterogeneity across sites. Descriptive statistics, Karl Pearson's bivariate correlation analysis delved into the relationships between physicochemical parameters and zooplankton diversity by statistical package for social science. Principal Component Analysis (PCA) was conducted with origin lab 2023. This multivariate approach distilled complex data into a visual representation, facilitating the identification of underlying patterns. The graphical outputs aided in elucidating the key variables driving the observed variability in the data. Using Paleontological Statistics Software Package for Education and Data Analysis (PAST 3.04) Canonical Correspondence Analysis (CCA) and different diversity indices of zooplankton was performed and different species diversity indices were calculated using standard formulas. Map of the study site was developed using Quantum Geographic Information System (QGIS) software.
Physicochemical parameters and zooplankton
The two-extreme quality of the waterbodies of Bankura district are shown in Figure 2. Variations of the water quality parameters of studied water bodies have been summarized in Table 1. One-way ANOVA of physicochemical parameters and zooplankton shows significant difference (p<0.05) for pH, DO, TH, EC, Phosphate-P, Nitrite-N, Cladocera, Rotifera and Protozoa (Table 2). With Pearson’s bivariate correlation analysis, it has been found that there was a strong positive correlation between Total Hardness (TH) and pH (r=0.778, p<0.01) (Figure 3). This suggests that higher total hardness corresponds to elevated pH levels in the waterbodies. There was a strong positive correlation between TH and bicarbonate (r=0.835; p<0.01), indicating that waterbodies with higher total hardness also have increased bicarbonate concentrations. Phosphate concentration demonstrated significant correlations, including negative associations with pH (r=-0.857; p<0.01), DO (r=-0.587; p<0.05), TH (r=-0.636; p<0.05) and EC (r=-0.624; p<0.05). Moreover, phosphate exhibited a positive correlation with nitrite (r=0.871; p<0.01). Nitrite concentration displayed significant negative correlations with pH (r=-0.744; p<0.01), DO (r=-0.682; p<0.05) and EC (r=-0.706; p<0.05). Additionally, nitrite shows positively correlation with phosphate (r=0.871; p<0.01). Boxplots of the nutrient parameters are shown in Figure 4. Cladocera abundance showed positive correlations with pH (r=0.778; p<0.01) and bicarbonate (r=0.835; p<0.01), while displaying a negative correlation with phosphate (r=-0.636; p<0.05). Rotifera abundance correlated positively with nitrite concentration (r=0.683; p<0.05). Protozoa exhibited significant correlations with pH (r=-0.792; p<0.01), TH (r=-0.673; p<0.05), chloride (r=-0.621; p<0.05), EC (r=-0.727; p<0.01), phosphate (r=0.736; p<0.01) and nitrite (r=0.613; p<0.05). Physicochemical parameters play a significant role to define the status of the waterbodies. DO, pH, EC play crucial roles in aquatic life maintenance. Carbon dioxide sources include respiration of aquatic organisms and atmospheric mixing with pond water. The statistical analysis using one-way ANOVA revealed noteworthy variations (p<0.05) among physicochemical parameters and zooplankton populations. The parameters that exhibited significant differences in different study sites include pH (F=38.00), DO (F=11.218), TH (F=5.518), EC (F=34.771), Phosphate-P (F=29.074), Nitrite-N (F=26.249), Cladocera (F=5.518), Rotifera (F=4.701) and Protozoa (F=24.701). These findings highlight the diverse responses within these parameters across the studied water bodies. The results align with previous studies conducted on different water bodies [19-22]. In few cases it is observed that standard deviations of the parameters are greater than the mean value, it may be due to the large variance of the data.

Figure 2: (A): Normal water body; (B): The yield of fishes; (C): Bloom forming water body; (D): The fatal condition of fish within the bloom forming waterbody.
| Parameters | Mean ± SD | 95% of CI | ANOVA (F) | P value |
|---|---|---|---|---|
| Water Temperature (°C) | 20.89 ± 3.83 | 18.46-23.32 | 1.076 | 0.324 |
| pH | 7.42 ± 0.60 | 7.03-7.79 | 38 | 0.000 |
| Dissolved oxygen (mg/l) | 160.84 ± 60.99 | 122.08-199.59 | 0.018 | 0.897 |
| Free carbon dioxide (mg/l) | 4.96 ± 1.79 | 3.81-6.09 | 11.218 | 0.007 |
| Chloride ions (Cl-) (mg/l) | 19.66 ± 6.11 | 15.77-23.53 | 0.423 | 0.53 |
| Total alkalinity (mg/l) | 126.11 ± 61.35 | 87.13-165.09 | 0.562 | 0.471 |
| Total hardness (mg/l) | 128.19 ± 30.54 | 108.78-147.59 | 5.518 | 0.041 |
| Bi carbonate (HCO3-) (mg/l) | 290.25 ± 147.51 | 196.52-383.97 | 1.363 | 0.27 |
| Phosphate-P (PO4-3) (mg/l) | 610 ± 252.84 | 449.35-770.64 | 34.771 | 0.000 |
| Ammonium-N (NH4-) (mg/l) | 1.46 ± 1.22 | 0.68-2.24 | 29.074 | 0.000 |
| Nitrite-N (NO2-) (mg/l) | 0.08 ± 0.13 | 0.00-0.16 | 0.414 | 0.534 |
| Conductivity (μS/cm) | 0.26 ± 0.27 | 0.08-0.43 | 26.249 | 0.000 |
| Cladocera (Nos/l) | 125.19 ± 30.54 | 108.78-147.59 | 5.518 | 0.041 |
| Copepoda (Nos/l) | 226.67 ± 260 | 61.46-391.86 | 0.192 | 0.671 |
| Rotifera (Nos/l) | 235.83 ± 287.83 | 52.96-418.70 | 4.701 | 0.055 |
| Ostracoda (Nos/l) | 115 ± 88.91 | 58.51-171.48 | 2.408 | 0.152 |
| Protozoa (Nos/l) | 1401.25 ± 1355.93 | 539.73-2226.76 | 17.177 | 0.002 |
Note: CI: Confidence Interval; ANOVA: Analysis of Variance; SD: Standard Deviation.
Table 2: Variation of the studied parameters in different study sites

Figure 3: Correlation matrix shows the significance of interdependency between physico-chemical parameters and zooplankton diversity. Note: WT: Water Temperature, TA: Total Alkalinity; DO: Dissolved Oxygen, FC: Free Carbondioxide, BC: Bicarbonate; TH: Total Hardness; EC: Electrical Conductivity, Cl-: Chloride ions.

Figure 4: Box plots represents the distribution of physicochemical parameters of (A): PH; (B): Total Hardness; (C): Electrical conductivity; (D): Chloride; (E): Phosphate-P and (F): Nitrite-N which have a significant (p<0.05) difference in normal waterbodies and bloom forming waterbodies.
Zooplankton diversity and bloom formation
The abundance of different zooplankton has been studied and result shows abundance of Rotifera, Protozoa, Ostracoda in the bloom forming waterbodies, whereas Cladocera was mainly found in the normal waterbodies (Figure 5). The various plankton diversity indices were calculated for different sampling sites (R1 to R6 and N1 to N6). These indices provide insights into the ecological diversity and evenness of zooplankton communities in the studied water bodies. The Dominance (D) index measures the abundance of the most dominant species relative to the total abundance of all species. Higher values of D indicate a dominance of few species, while lower values suggest a more evenly distributed community. Our results reveal varying levels of dominance across sites, ranging from 0.488 to 0.903. Simpson’s diversity index (1-D) quantifies the probability that two randomly selected individuals from the community belong to different species. Higher values of 1-D indicate greater diversity and evenness in species distribution. Our calculations show that Simpson's diversity index ranges from 0.726 to 0.949 across the sampled sites. The Shannon-Wiener diversity index (H) combines both species richness and evenness in its calculation. It provides a comprehensive view of species diversity within a community. Our analysis reveals Shannon-Wiener diversity index values ranging from 1.47 to 1.85 across the studied sites. Menhinick's index is a measure of species richness relative to the square root of total abundance. It provides insights into the species richness per individual. Our results indicate Menhinick's index values ranging from 0.261 to 0.373. Equitability (J) is a measure of how evenly individuals are distributed among species within a community. Higher values of J indicate a more equitable distribution of species. Present study displays Equitability index values ranging from 0.293 to 0.453. The Berger-Parker index reflects the proportion of the most dominant species in the community. It provides insights into the dominance of a few species relative to the total abundance. Our results show Berger-Parker index values varying from 0.515 to 0. 903. Evenness (eH/S) considers both the Shannon-Wiener diversity index (H) and taxa richness (S) to provide a measure of community evenness. Higher values of evenness indicate a more balanced distribution of species. Our analysis indicates evenness values ranging from 0.294 to 0.482. All the diversity indices reveal varying degrees of species richness, dominance, diversity and evenness across the sampled sites (Figure 6). These indices collectively contribute to our understanding of the ecological composition and dynamics of the zooplankton communities in the studied water bodies. The study indicates that plankton is essential for fisheries and aquaculture research, as it directly impacts fish production. Zooplankton, particularly Cladocera, Copepoda, Rotiferas, Ostracods and Protozoans, play pivotal roles in freshwater ecosystems. Among these, Cladocera dominate, contributing to fish nutrition and acting as pollution indicators [23]. Copepoda, the third most abundant zooplankton group, supports freshwater aquaculture. Abundance of copepods are found in normal waterbodies which are highly preferable for aquaculture. Rotiferas, possessing a short life cycle, are important indicators of aquatic pollution. They were observed in both types with higher abundance in normal waterbodies compared to bloom forming waterbodies. Ostracods were observed in both types of waterbodies but their decreased abundance in type II ponds may affect fish yield. Protozoa, particularly Euglena sp., displayed notable populations in bloom forming waterbodies and a minor presence in normal waterbodies. Euglena sp., capable of toxic impacts and overgrowth under specific conditions, can adversely affect aquatic environments [24]. Nutrients like Phosphate-P, Nitrite-N and Ammonium-N has also a leading role in the water ecosystem. Comparing the standard values of these nutrients we have found that bloom forming waterbodies are nutrient rich waterbodies with high value of Phosphate-P. This is called cultural eutrophication which may be caused by anthropogenic activities [25].

Figure 5: Different diversity indices of abundance of zooplankton in different study sites (R1 to R6 represents the bloom forming waterbodies and N1 to N6 represents the normal waterbodies) are calculated using standard formulas.

Figure 6: Different groups of zooplankton identified in the study site.
Euglena sp., a protist prevalent in freshwater environments worldwide, possesses a retractable flagellum that typically remains within the cell body, even when fully extended. Additionally, these organisms are characterized by granular eye spots of various types and have been observed to reproduce asexually through mitosis. Being photosynthetic algae, they function as autotrophs containing chlorophyll and an accessory pigment called astaxanthin, which serves as a carotenoid. This accessory pigment plays a crucial role in preventing the cell's chloroplast from becoming overwhelmed by excessive light conditions. Consequently, cells exhibit a red hue when utilizing this pigment and a green color when the pigments retract into vesicles. An intriguing aspect of Euglena sp., is the production of a compound known as euglenophycin, which exhibits ichthyotoxic, herbicidal and anticancer properties at low concentrations, ranging from parts per million (ppm) to parts per billion (ppb) dosages [26]. Researchers have hypothesized that this toxin functions as a neurotoxin due to its impact on behavioural changes. Notably, juvenile catfish exposed to cultures of the algal isolates experienced mortality within 2 hours of exposure [27]. Some species of euglenophytes have been observed to possess a red coloration or the ability to turn red, which is attributed to Euglena sp., This microalga, commonly inhabiting eutrophic lentic freshwater habitats globally, was originally described from a red-colored water sample from Silesia. It is worth noting that the cells initially appear green and later turn red. The present study further unveiled the robust growth of Euglena sp., in shallow-water ponds during the transition from winter to summer.
Principal component analysis
The results of the Principal Component Analysis (PCA) demonstrated significant correlations among water temperature, dissolved oxygen and pH concerning zooplankton density. These findings strongly underscore the substantial role these parameters play in facilitating the heightened growth and production of zooplankton. The significant correlation observed through PCA signifies the potential utility of these interrelated physicochemical and biological factors in effectively promoting zooplankton growth. These further underscores the efficacy of PCA as a valuable tool for pattern recognition, aiming to elucidate the variance within an extensive dataset of interdependent variables through a more concise set of independent variables [28]. The first five Principal Components (PC1 to PC5) capture the majority of the variance in the dataset. PC1, which has the highest eigenvalue, explains 38.44% of the variance (Table 3). As we move down the list of principal components, each subsequent PC explains progressively less variance. These five principal components collectively explain 88.16% of the total variance in the dataset. The cumulative variance indicates the total amount of variance explained by the included principal components. In this analysis, the cumulative variance reaches 92.19% with just six components, indicating that a substantial amount of information from the original dataset can be captured using a smaller number of components. PCA results suggest that a significant portion of the variability in the dataset can be summarized by a smaller number of principal components. These components likely represent the underlying patterns and relationships between the physicochemical parameters and plankton diversity across the sampled sites. Researchers can use these principal components to identify key factors driving the observed variation and potentially uncover hidden trends in the data. Graphical representation of principal component analysis provides a compact exposure of the complex relationships between physicochemical parameters and plankton diversity, offering insights into the primary sources of variability within the studied water bodies (Figure 7).
| PC | Eigen value | Variance (%) | Cumulative variance (%) |
|---|---|---|---|
| PC1 | 6.53453 | 38.44% | 38.44% |
| PC2 | 3.29814 | 19.40% | 57.84% |
| PC3 | 2.33013 | 13.71% | 71.55% |
| PC4 | 1.58942 | 9.35% | 80.90% |
| PC5 | 1.23493 | 7.26% | 88.16% |
| PC6 | 0.68512 | 4.03% | 92.19% |
| PC7 | 0.47 | 2.76% | 94.95% |
| PC8 | 0.40226 | 2.37% | 97.32% |
| PC9 | 0.2817 | 1.66% | 98.98% |
| PC10 | 0.10073 | 0.59% | 99.57% |
| PC11 | 0.07304 | 0.43% | 100.00% |
| PC12 | 0 | 0.00% | 100.00% |
Note: PC: Principal Component.
Table 3: Eigen value (value of the root character) of physicochemical parameters and zooplankton of different PCs.

Figure 7: Principal component analysis shows the first loadings of first three major components where PC1 shows 38.44% of total variance, PC2 shows 19.40% of total variance and PC3 shows 13.71% of total variance. Note: PC: Principal Component; WT: Water Temperature; TA: Total Alkalinity; DO: Dissolved Oxygen; FC: Free Carbon dioxide; BC: Bicarbonate; TH: Total Hardness; EC: Electrical Conductivity; Cl-: Chloride ions.
Canonical correspondence analysis
Canonical Correspondence Analysis (CCA) technique was employed to establish relationships between physicochemical variables and phytoplankton [29]. Serving as a direct gradient analysis method, CCA extracts synthetic gradients from both biotic and environmental matrices [30]. CCA shows the correlation between the environmental parameters with the biological parameters. CCA results show the relationships between biological variables and environmental variables in two-dimensional space (Axis 1 and Axis 2) (Figure 8). The loadings of species and environmental variables on these axes provide insights into the significant associations between species composition and environmental conditions. Axis 1 represents the primary source of variability in the dataset. The species and environmental variables that have strong loadings on this axis contribute significantly to explaining the observed variation. Positive loadings of Copepoda, Rotifera, Ostrocoda, EC, FC, TH, Cl-, pH, BC, Protozoa and negative loadings of NO2-, PO4-3, NH4+, DO, TA, WT and Cladocera is found in Axis 1. These loadings suggest that Axis 1 represents a gradient related to specific species abundances (Copepoda, Rotifera, Ostrocoda, Protozoa) and environmental variables (EC, FC, TH, Cl-, pH, BC) that influence species distribution. Conversely, other species and variables may be negatively associated with this gradient. Axis 2 represents the secondary source of variability. The loadings on this axis contribute to explaining additional variation beyond Axis 1. FC, Cl-, TH, pH, Copepoda, EC have positive loadings and NO2-, PO4-3, DO, Cladocera, NH4+, WT, Ostrocoda, Protozoa have negative loadings with Axis 2. It may represent another set of species-environment associations. Positive loadings indicate species and variables that align with this axis, while negative loadings indicate those that are negatively aligned.

Figure 8: Canonical correspondence analysis shows the correlation between the biological parameters (zooplankton groups: Cladocera, Copepoda, Rotifera, Ostracoda and Protozoa) and environmental parameters (WT, pH, TA, DO, FC, BC, TH, Cl-, EC, Phosphate-P, Ammonium- N, Nitrite-N). Note: CCA: Canonical Correspondence Analysis; WT: Water Temperature; TA: Total Alkalinity; DO: Dissolved Oxygen; FC: Free Carbon dioxide; BC: Bicarbonate; TH: Total Hardness; EC: Electrical Conductivity; Cl-: Chloride ions.
The water quality index
In this present study, the Water Quality Index (WQI) (Table 4) has played a major role to evaluate the status of the waterbodies. In sample R1 (Hati bari-1) WQI value was 100.9 (unsuitable). In sample R3 (Sima bandh) WQI value was 80.34 (very poor). In sample R4 (Hati bari-3) and R6 (Rakshit pukur) WQI value were 52.09 (poor) and 70.01 (poor) respectively. These waterbodies are major sources of red bloom formation. WQI value of sample R2 (Hati bari-2), R5 (Had gora pukur), N2 (Tambli band pond) and N4 (Shit pukur lane area pond 2) were 40.72 (good), 34.48 (good), 32.06 (good), 28.07 (good) respectively. Initial stage of bloom formation has been found in sample site R2 and R5. Excellent class of water has been noted in sample N1 (Police lane area pond), N3 (Shit pukur lane area pond 1), N5 (Rath tala area pond) and N6 (Dol mandir area pond). In these waterbodies, no bloom has been found and they are ideal for aqua culture.
| Sample No. | Place | Latitude | Longitude | Water quality index | Class |
|---|---|---|---|---|---|
| R1 | Hati bari-1 | 23°05'34.7"N | 87°15'53.4"E | 100.09 | Unsuitable |
| R2 | Hati bari-2 | 23°05'36.8"N | 87°15'52.3"E | 40.72 | Good |
| R3 | Sima bandh | 23°05'42.8"N | 87°15'31.0"E | 80.34 | Very Poor |
| R4 | Hati bari-3 | 23°05'37.9"N | 87°15'29.7"E | 52.09 | Poor |
| R5 | Had gora pukur | 23°05'51.2"N | 87°16'50.5"E | 34.48 | Good |
| R6 | Rakshit pukur | 23°05'55.6"N | 87°16'46.4"E | 70.91 | Poor |
| N1 | Police line area pond | 23°14′03.6″N | 87°03′26.5″E | 13.68 | Excellent |
| N2 | Tambli band pond | 23°14′14.1″N | 87°03′35.2″E | 32.06 | Good |
| N3 | Shit pukur lane area pond 1 | 23°13'51.9"N | 87°04'12.2"E | 16.38 | Excellent |
| N4 | Shit pukur lane area pond 2 | 23°13'51.8"N | 87°04'15.1"E | 28.07 | Good |
| N5 | Rath tala area pond | 23°14′18.1″N | 87°04′20.8″E | 7.15 | Excellent |
| N6 | Dol mandir area pond | 23°14'14.1"N | 87°04'22.3"E | 4.85 | Excellent |
Table 4: Water quality index of different study sites.
This study examines the connections between physicochemical parameters and plankton distribution in diverse waterbodies around Bankura district. The research reveals significant correlations between plankton diversity and underlying physicochemical attributes. The investigation involved meticulous collection and measurement of water and plankton samples using established methodologies from August 2022 to May 2023. The study categorized waterbodies into normal and bloom forming, employing statistical methods like ANOVA and Pearson's correlation to identify differences and associations. The results uncover strong correlations between physicochemical parameters and zooplankton groups. Nutrient enrichment occasionally led to eutrophication and toxic algal blooms, particularly Euglena sp., Diversity indices and artificial neural networks were used for predictive modeling of water quality and ecosystem health. Water bodies play a very crucial role in the society, influenced by complex factors. With increasing concerns about water quality and harmful algal blooms, this study emphasizes the significance of balanced physicochemical parameters for plankton diversity. Water, a limited resource faces growing challenges day by day due to pollution. Present research contributes insights into pond ecosystems, highlighting their dependence on physicochemical equilibrium and plankton distribution.
Artificial Neural Network (ANN) and other machine learning methods may play a vital role in the prediction of Water Quality Index (WQI) using physicochemical parameters. These physicochemical parameters obtained from a diverse range of water bodies forms patterns which may be recognized by ANNs and speed up the process of evaluation of WQI. The ANNs may even be used to analyze the connections between physicochemical parameters and plankton distribution in diverse waterbodies. The ANNs and other machine learning methods may even be used to categorize waterbodies into normal and bloom forming, to identify differences and associations and may be used to uncover strong correlations between physicochemical parameters and zooplankton groups. ANNs and other machine learning models and their ensemble approach may be used for a fast and accurate evaluation of the results in future.
[Crossref] [Google Scholar] [PubMed]
[Crossref] [Google Scholar] [PubMed]
[Crossref] [Google Scholar] [PubMed]
[Crossref] [Google Scholar] [PubMed]
[Crossref] [Google Scholar] [PubMed]
[Crossref] [Google Scholar] [PubMed]
Citation: Mahanty S, Saha D, Karmakar A, et al. Assessing the waterbodies through water quality index and zooplankton diversity for environmental sustainability of Bankura, West Bengal, India. AGBIR.2024;40(2):1021-1029.
Received: 28-Feb-2024, Manuscript No. AGBIR-24-129816; , Pre QC No. AGBIR-24-129816 (PQ); Editor assigned: 01-Mar-2024, Pre QC No. AGBIR-24-129816 (PQ); Reviewed: 15-Mar-2024, QC No. AGBIR-24-129816; Revised: 22-Mar-2024, Manuscript No. AGBIR-24-129816 (R); Published: 29-Apr-2024, DOI: 10.35248/0970-1907.24.40.1021-1029
Copyright: This open-access article is distributed under the terms of the Creative Commons Attribution Non-Commercial License (CC BY-NC) (http:// creativecommons.org/licenses/by-nc/4.0/), which permits reuse, distribution and reproduction of the article, provided that the original work is properly cited and the reuse is restricted to noncommercial purposes. For commercial reuse, contact reprints@pulsus.com This is an open access article distributed under the terms of the Creative Commons Attribution License, which permits unrestricted use, distribution, and reproduction in any medium, provided the original work is properly cited.


