An International Journal
Agricultural and Biological Research
ISSN - 0970-1907
RNI # 24/103/2012-R1
RNI # 24/103/2012-R1
Research Article - (2025) Volume 41, Issue 2
This research investigates the spatial variability of soil loss in the Angreb Catchment, located in the Amhara region of Ethiopia, utilizing the Revised Universal Soil Loss Equation (RUSLE). Soil erosion poses a significant threat to agricultural productivity and environmental sustainability in the region. The study integrates various factors such as rainfall, soil erodibility, slope characteristics, land cover, and erosion control measures into the RUSLE model to estimate and map the potential soil loss across the catchment. Geographic Information System (GIS) tools are employed to visualize and analyse the spatial distribution of soil erosion risk. Field data collection includes detailed assessments of soil types, land use patterns, and erosion control practices. The results provide valuable insights into the area’s most susceptible to soil loss, guiding the formulation of targeted land management strategies for sustainable soil conservation and agricultural development in the Angreb Catchment. This research contributes to the broader understanding of soil erosion dynamics in the region and underscores the importance of informed land-use planning for mitigating the impacts of soil degradation.
Spatial variability; GIS; RUSLE; Soil erosion
Soil erosion is a critical environmental challenge with far-reaching implications for agricultural productivity, ecological integrity, and sustainable land use. In the Amhara region of Ethiopia, the Angreb Catchment stands as a microcosm of the intricate interplay between natural processes and human activities, where soil erosion poses a significant threat to the region's socio-economic fabric. This study aims to contribute to a comprehensive understanding of the spatial variability of soil loss in the Angreb Catchment by employing the Revised Universal Soil Loss Equation (RUSLE), a widely recognized model for assessing soil erosion risk.
The Amhara region, known for its diverse landscapes and agricultural practices, is particularly vulnerable to soil degradation due to a combination of factors such as topography, rainfall patterns, and land management practices. As global concerns regarding food security and environmental sustainability escalate, the need to assess and mitigate soil erosion becomes paramount. The Angreb Catchment, as a focal point for this investigation, presents an opportunity to delve into the localized intricacies of soil erosion dynamics.
This research integrates field-based data collection with advanced Geographic Information System (GIS) tools to comprehensively analyze the factors influencing soil loss. Through the lens of the RUSLE model, we aim to estimate and map the spatial distribution of soil erosion risk across the catchment, identifying areas of heightened vulnerability. Such insights are crucial for developing targeted and effective soil conservation strategies that align with the unique characteristics of the Angreb Catchment.
By shedding light on the complex interactions between natural and anthropogenic factors contributing to soil erosion, this study seeks not only to enhance the scientific understanding of soil dynamics in the region but also to provide actionable information for sustainable land management practices. The findings of this research are anticipated to inform local stakeholders, policymakers, and land managers, facilitating evidence-based decision-making and contributing to the broader discourse on soil conservation and environmental sustainability in the Amhara region and beyond.
Area under investigation
The Angereb watershed is situated in the central Gondar zone within the Amhara region of Ethiopia. As part of the Abbay basin, it spans an area of 809.6 km2 and is positioned between latitude: 12°25′00′′N and 12°45′00′′N, as well as longitude: 37°20′00′′E and 37°50′00′′E. The elevation within the Angereb watershed varies from 1762 m to 2956 m above mean sea level, encompassing diverse topographical features ranging from flat terrain to undulating and steep areas (Figure 1) [1].

Figure 1) Location of study area in the Amhara region, Ethiopia
Data collection and source
To assess soil erosion in the Angereb watershed, a combination of primary and secondary data was utilized. Landsat 8 images covering the watershed were gathered, and 250 data points were obtained through field visits using a Global Positioning System (GPS). Monthly rainfall data spanning a decade (2005 to 2014) from six meteorological stations within and around the watershed were sourced from the Ethiopian National Meteorology Agency (NMA). Additionally, soil information was extracted from the Blue Nile databases (Table 1) [2].
| No. | Data type | Resolution | Source | Purpose |
| 1 | Rainfall data | 30 m × 30 m | National metrological agency, Bahir Dar branch |
Rainfall and map and R-factor |
| 2 | Soil map | 30 m × 30 m | Ministry of Water, Irrigation and Energy (MOWIE) |
Soil map of study area and extract K-Value |
| 3 | DEM | 30 m × 30 m | Downloaded from the US. geologic survey | For watershed delineation, slope, LS-factor |
| 4 | Land Sat 8 satellite image OLI_TIRS_2020 |
30 m × 30 m | Downloaded from US. geologic survey |
Land use/over of 2020 and C and P-factor |
TABLE 1 The required data types, sources and purpose
Description of Revised Universal Soil Loss (RUSLE) model
The Revised Universal Soil Loss Equation (RUSLE) is a commonly employed mathematical model created for the purpose of estimating and projecting rates of soil erosion. Originating from the U.S. Department of Agriculture (USDA), the RUSLE model is designed to quantify the annual soil loss, on average, resulting from sheet and rill erosion within a defined field or area. Initially introduced in the 1980’s, the equation has undergone subsequent revisions to improve its precision and adaptability across various geographical settings [3-8].
Method of data analysis
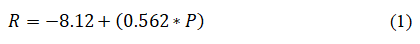
Revised universal soil loss equation model parameters estimation: Rainfall Erosivity factor (R-factor): The estimation of the R factor initially relies on both rainfall and rainfall intensity. However, in developing countries where such data are often unavailable without standard meteorological stations, a common approach involves using correlations between the R factor and annual rainfall. This method, as outlined by Hurni for Ethiopian conditions (equation 1), serves as a practical solution [9].
To calculate the rainfall Erosivity factor (R), equation 1, as specified by Hurni, was employed in ArcGIS spatial analyst. The results were then transformed into two raster surfaces using the Inverse Distance Weighting (IDW) interpolation method, as recommended by Hurni. In areas where meteorological stations are closely spaced and topography has minimal impact, the IDW interpolation method was suggested for estimating missing data, following the approach proposed by Lam [10].
Where:
R=Rainfall erosivity factor
P=Mean annual rainfall in mm
Soil erodibility factor: The assessment of the soil erodibility factor typically involves conducting field observations and performing laboratory analyses on soil samples. Erodibility factors vary across different soil types and conditions, playing a pivotal role in predicting the potential for soil erosion in a specific locality. The K factor, reflecting soil erodibility, is subsequently incorporated into erosion models, offering a comprehensive understanding of soil loss dynamics and facilitating the formulation of effective soil conservation strategies. In this research, K-values in the study area were determined using the soil color type approach recommended by Hurni for Ethiopia's conditions. The soil unit map for the study area was derived from the Abbay basin authority database [11-12].
Topographic factor: The variables representing Slope Length factor (L) and Steepness factor (S) within the RUSLE model, which amalgamate the influences of both slope length and steepness, consider the impact of topography on soil erosion. In this study, the slope gradient was computed using a 30-meter resolution Digital Elevation Model (DEM). The LS factor for this investigation is determined through an equation using a raster calculator, as developed by Moore and Burch and Panagos, et al. [13,14]:

Where:
LS: Slope length and steepness factor
Slope: Degree generated from DEM
Land cover and management factor: The land cover and management factor (C) assesses the influence of vegetation, land management practices, and erosion control strategies on soil loss. Utilizing information from existing literature, a C factor value was assigned to each land-use class.
Conservation practice factor: The Conservation Practice factor (P) factor measures the difference between soil loss following conservation practices and soil loss following straight row farming running up and down a slope [15]. Based on the available literature the equivalent P-value was assigned to each land-use class.
Estimation of soil loss: The study area employed the Revised Universal Soil Loss Equation (RUSLE) along with GIS and remote sensing methodologies to forecast the annual soil loss. RUSLE has the capability to assess soil erosion on a broad scale, encompassing entire river basins or specific agricultural plots. Its mathematical representation is as follows:
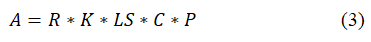
Where:
A: Average yearly soil loss (metric tons ha-1 year-1)
R: Rainfall erosivity factor (Mega Joules mmperhha-1 year-1)
K: Soil erodibility factor (metric tons ha-1 MJmm-1)
LS: Slope length-steepness factor (dimensionless)
C: Cover and management factor (dimensionless)
P: Erosion support practice or land management factor (dimensionless)
All five parameter maps (with the same coordinate system) were resampled to a grid with a 30-meter by 30-meter cell size for the estimation and mapping of the geographical distribution of soil loss in the study region. Using the ArcGIS tool raster calculator, the annual soil loss rate was determined spatially by multiplied the RUSLE components pixel-by-pixel using equation 3 (Figure 2).

Figure 2) Methods employed to estimate soil loss by RUSLE model Note: IDW: Inverse Distance Weighted; DEM: Digital Elevation Model
Spatial distribution of soil loss
It is crucial to identify the spatial patterns of soil erosion to effectively tackle the issue of soil loss through the implementation of suitable soil and water conservation measures. The research results indicate that, according to the RUSLE model, the total annual soil loss in the studied area is approximately 606,381 tons per hectare (Figure 3).

Figure 3) Spatial distribution of mean annual soil loss in Angereb watershed
Land use of the watershed
Land use/land cover plays a crucial role in influencing surface runoff and erosion within a watershed. Through supervised image classification in the watershed, primary land uses/covers were identified, including forestland, built-up areas, pastureland, water bodies, and agricultural land. In the context of this research, agricultural land signifies areas currently cultivated, temporarily fallow, or designated for cultivation in the near future. Meanwhile, pasture land represents regions with short vegetation and grasslands (Figure 4).

Figure 4) Land use/cover map of Angereb watershed for the year 2020
Soil loss factors estimations
Rainfall erosivity factor: The average annual rainfall and R factor values for the Angereb watershed vary between 1061.40 to 1138.07 mm and 588.38 to 631.47 MJ/mm/ha/h/year, respectively (Figure 5).

Figure 5) Rainfall map and Erosivity map (R)
Soil erodibility factor: Soil erodibility reflects the influence of soil characteristics on soil erosion. A higher k factor value signifies soil types that are more susceptible to erosion, while a smaller value indicates less vulnerability. In accordance with recommendations from previously published articles, the K-factor. The soils were converted from vector to grid format. The soil erodibility map reveals that Eutric Fluvisols and Eutric Nitosols, Lithosols have higher K values (0.3 and 0.25, respectively), indicating increased sensitivity to soil erosion. On the other hand, Chromic Luvisols, Eutric Cambisols, and Orthic Luvisols exhibit medium k values (0.2), while Chromic Vertisols have smaller k values (0.15), signifying moderate vulnerability. Additionally, rock is identified as having constraints to soil erosion (Figure 6).

Figure 6) Soil and soil erodibility map
Topographic factor: The topographic factor (LS), obtained from both slope length and slope steepness, played a crucial role in determining the rate of soil erosion. By utilizing the raster calculator in ArcGIS, the LS factor was computed through the application of Equation 3, which involves flow accumulation and slope steepness. Consequently, the LS factor for the watershed spanned from 0 to 268.93 (Figure 7).

Figure 7) Slope length and steepness factor map
Land Cover and management (C) factor: In a GIS setting, a C value corresponding to the land use/cover of the study area was designated in accordance with the findings of various researchers (Table 2). The resultant C factor maps were then visualized in Figure 8 [16-18].
| No. | Land use/Land cover | C-factor |
| 1 | Agricultural land | 0.15 |
| 2 | Built-Up area | 0.09 |
| 3 | Pasture land | 0.08 |
| 4 | Forest land | 0.02 |
| 5 | Water bodies | 0 |
TABLE 2 Land cover classes and relevant C-factor value

Figure 8) Land use/Cover and crop management factor (C)
Land management practice factor: According to the literature, the P-factor value for all land uses ranges from 0 to 1, with a value near 0 indicating strong conservation practice and a value near 1 indicating poor conservation behavior (Table 3 and Figure 9) [19,20].
| No. | Land use/Land cover | P-factor |
| 1 | Built-up area | 1 |
| 2 | Pasture land | 0.8 |
| 3 | Agricultural land | 0.5 |
| 4 | Forest land | 0.1 |
| 5 | Water bodies | 0 |
TABLE 3 P factor with corresponding land use/cover types

Figure 9) Land use/cover and P-factor
In conclusion, this study has provided a comprehensive analysis of the spatial variability of soil loss in the Angreb Catchment, situated in the Amhara region of Ethiopia, using the Revised Universal Soil Loss Equation (RUSLE). The research aimed to contribute valuable insights into the complex dynamics of soil erosion, offering a foundation for informed land management practices and sustainable agricultural development in the region.
The integration of field data collection and advanced Geographic Information System (GIS) techniques allowed for a thorough examination of the factors influencing soil loss. The application of the RUSLE model facilitated the estimation and mapping of potential soil erosion across the catchment, providing a nuanced understanding of the areas most susceptible to degradation.
The findings revealed notable spatial variability in soil loss, with certain areas demonstrating heightened vulnerability due to a combination of factors such as topography, rainfall patterns, and land use practices. These insights are crucial for the identification of priority areas for soil conservation efforts and the formulation of targeted land management strategies.
The study also emphasized the significance of considering multiple factors, including rainfall erosivity, soil erodibility, topography, land cover, and conservation practices, in the assessment of soil loss. The RUSLE model, as applied in this research, proved to be a valuable tool for quantifying these factors and generating spatially explicit information for effective decisionmaking.
Furthermore, the results of this study have implications for sustainable agriculture and environmental conservation in the Angreb Catchment and similar regions. The information provided can guide local stakeholders, policymakers, and land managers in implementing evidence-based measures to mitigate soil erosion, enhance agricultural productivity, and promote long-term environmental sustainability.
The required data collected and materials for analysis are included in the manuscript. The corresponding author is ready to clarify the data and provides all the necessary data sets as per the request.
[Crossref] [Google Scholar] [PubMed]
Received: 27-Dec-2023, Manuscript No. AGBIR-23-123539; , Pre QC No. AGBIR-23-123539 (PQ); Editor assigned: 29-Dec-2023, Pre QC No. AGBIR-23-123539 (PQ); Reviewed: 12-Jan-2024, QC No. AGBIR-23-123539; Revised: 11-Feb-2025, Manuscript No. AGBIR-23-123539 (R); Published: 18-Feb-2025, DOI: 10.37532/0970-1907.25.41(2).1-6


