An International Journal
Agricultural and Biological Research
ISSN - 0970-1907
RNI # 24/103/2012-R1
RNI # 24/103/2012-R1
Research Article - (2023) Volume 39, Issue 5
A progressive decline in soil fertility in taro (Colocasia esculenta L., Schott) production systems has led to reduced crop productivity and farm profitability, and is recognized as a major threat to soil and food security in Samoa. This paper reports the results of three years of field experimentation aimed at improving soil nutrient management practices and quantifying yield gaps in taro production systems. Experimental sites were established at two locations in Upolu Island to study the effects of crop nutrition on the soil nutrient balance, taro yield and nutrient recovery in harvested plant material (corm). Treatments included: (1) standard practice (no nutrients applied), (2) legume intercropping using Mucuna pruriens and Erythrina subumbrans, (3) application of NPK+S fertilizer, and (4) application of composted poultry manure. The evidence shows that appropriate nutrient budgeting is required to reduce current soil nutrient deficits and mitigate the loss of soil organic C, and that balanced crop nutrition should improve productivity and contribute to narrowing yield gaps. The paper also considered the need to develop a framework to guide nutrient recommendations for taro. This framework proposes that recommendations for N be derived from yield-to-N response functions (from which the most economic rate of N can be estimated), and that for other nutrients (P, K, Ca, Mg) recommendations be based on replacement. The replacement strategy requires the development of soil Indexes, which can be used to define the long-term nutrient management policy at a given site or field. This long-term policy is informed by soil analyses, and it will determine whether there is a need to build-up or maintain soil nutrients levels, or whether application can be omitted in some years because nutrient levels exist within a range that is satisfactory both from the agronomic and environmental perspectives.
Composted poultry manure; Fertilizer recommendations; Legume intercropping; Nutrient cycling; Soil nutrient balance; Soil nutrient index
Pacific Island nutrient cycles have been increasingly modified since human settlement more than 2000 years ago. Agricultural intensification in Pacific countries has resulted in further changes in the islands’ nutrient flows [1]. Nutrients exported from croplands in Samoa are a major production constraint, and in some cases, the primary cause of yield gap (that is, the difference between attainable yield and on-farm actual yield) [2]. In cultivated soils, this problem is compounded by a concurrent decline in organic carbon [3,4]. The imbalance in Nitrogen (N), Phosphorus (P), and Potassium (K) is only one aspect of the plant nutrition and should be used to highlight the need to adequately understand nutrient flows, nutrient management, and budgeting in tropical agricultural systems and in doing so ensuring Soil Organic Carbon (SOC) levels are (at least) maintained [5].
In Samoa, taro (Colocasia esculenta L., Schott) is a major dietary staple and an important source of export earnings. Taro growers in Samoa, especially those producing taro for subsistence, do not use any fertilizer or soil amendment, and some growers claim it affects the quality and taste. Despite this, taro has been found to respond well to the application of fertilizers and organic amendments such as composts and manures [6]. Research has also shown that the use of soil amendments in taro production is economically viable and improves the quality (e.g., protein content) of the corm [7,8]. Typically, taro is planted between September and November, immediately before the wet season, and harvested between 6 and 11 months after planting [9].
This paper reports the results of three years of field experimentation aimed at improving soil nutrient management practices, and quantifying yield gaps and nutrient balances in taro production systems. Experimental sites were established at two locations in Upolu Island to study the effects of crop nutrition on the soil nutrient balance, taro yield and recovery of applied nutrients in harvested plant material (corm). Treatments included: (1) standard practice (no nutrients applied), (2) legume intercropping using Mucuna pruriens (L., DC.) and Erythrina subumbrans (Hassk., Merr.), (3) application of NPK+S fertilizer, and (4) application of composted poultry manure. The paper also discusses the need to develop a framework to guide nutrient recommendations for taro. Improved understanding of soil nutrient dynamics and development of nutrient guidelines for taro production systems will improve soil and food security in Samoa.
Experimental sites
Field trials were setup at the Crop Development Station of the Samoan Ministry of Agriculture and Fisheries at Nu’u (13°49.829’S, 171°50.193’W, elevation: 71 m ASL) in August 2018 (henceforth Nu’u 1) and December 2020 (henceforth Nu’u 2), respectively. A remote site was also established at a commercial farm in southern Upolu (14°00.432’S, 171°39.492’W, elevation: 181 m ASL) in September 2018 (henceforth Faleãlili). The two locations are shown in Figure 1.

Figure 1: A map of Upolu Island (Samoa) showing the locations of experimental sites established in 2018 and 2020.
The climate for Upolu is tropical, hot, humid, and rainy throughout the year, with relative maximum rainfall occurring from December to March, and minimum from June to September. The mean annual rainfall is 2800 mm. Rainfall occurs in the form of downpours or thunderstorms, which are often intense but usually short-lived; except between December and March, when rainfall duration increases.
Temperatures vary little throughout the year, and they are slightly warmer between December and April compared to the period May-November. On average, the thermal amplitude between day and night is about 10°C, with night temperatures typically above 20°C. Mean relative humidity is approximately 80%. Historic rainfall and temperature records for Upolu are shown in Table 1.
| Month | Rainfall (mm) | Rainy days | TMin (°C) | TMax (°C) |
|---|---|---|---|---|
| January | 450 | 19 | 24 | 30 |
| February | 380 | 18 | 24 | 30 |
| March | 350 | 17 | 24 | 30 |
| April | 250 | 15 | 24 | 30 |
| May | 160 | 13 | 24 | 30 |
| June | 120 | 11 | 24 | 29 |
| July | 80 | 8 | 23 | 29 |
| August | 80 | 9 | 23 | 29 |
| September | 130 | 12 | 23 | 29 |
| October | 170 | 14 | 24 | 30 |
| November | 260 | 16 | 24 | 30 |
| December | 370 | 17 | 24 | 30 |
| Annual | 2800 | 169 | 23.7 | 29.7 |
Table 1: Long-term (1950-2009) monthly rainfall, number of rainy days per month, and mean minimum (TMin) and mean maximum (TMax) temperature records for Upolu, Samoa.
The trials at Nu’u 1 and Faleãlili were laid-out in a completely randomized block (n=4) design and were established to compare the agronomic performance of taro (Colocasia esculenta L., Schott) without (control) and with intercropped legumes (Mucuna pruriens L., DC., and Erythrina subumbrans Hassk., Merr.). The taro variety used at all sites was Samoa II, which is resistant to taro leaf blight (Phytophthora colocasiae Racib.) [10]. The trial sites had 12 plots (dimensions: 7 m long by 6 m wide) and there was a 0.5 m buffer between-plots. Within each plot, there were 42 taro plants, which were established using a 1 m × 1 m planting system [11]. At Nu’u 1, taro was planted in late August 2018 and harvested on 12th March 2019. At Faleãlili, taro was planted in late September 2018 and harvested on 7th May 2019. Both legumes were established simultaneously with the taro crops to test their ability to supply Nitrogen (N) to the crop and consequently reduce the reliance on applied N (e.g., synthetic fertilizer, organic amendment). The legume plants were trimmed as needed to avoid any interference with adjacent plots. Any overgrown part of the legume plants that extended outside the plots were cut away and mulched down on the same plot to ensure no additional nutrients were removed from the designated plot. At Nu’u 2, the trial was also laid-out in a completely randomized block design (n=3) to compare the agronomic performance of taro with and without addition of soil amendments; namely: NPK+S fertilizer (12:8:15+3, commercially known as Blaukorn Classic®) and composted poultry manure (>¾ by weight was poultry manure with the balance made up of malt waste from breweries, desiccated coconuts, and coral chips). These fertilizer materials are commonly used in situations where taro crops are supplied with external nutrients. At Nu’u 2, split-plot design was then used to compare taro yield and nutrient use efficiency as affected by amendment type and placement (surface application vs. incorporated). For the surface application treatment, the amendment was spread around, and in the proximity (<150 mm) of the taro plants. For the incorporation treatment, the amendment was placed beneath the taro plant in the hole dug by the field operator at planting (at approximately 150 mm below the soil surface). A thin layer of soil was then added on top of the amendment to avoid direct contact between this and the taro plant. Both amendments were applied at planting at a standard rate of 50 g of product (fresh weight basis) per plant, which equated to the ‘half-hand full’ rate used by local farmers. Therefore, the application rate used at Nu’u 2 represented the standard (local) agronomic practice, and the planting system was the same as that described for Nu’u 1 and Faleãlili.
Soil measurements and analyses
Soil chemical analyses were conducted at the SROS Laboratories (The Scientific Research Organization of Samoa at Apia, https://sros.org.ws/) prior to the experiments using the methods adopted by SPACNET (The South Pacific Agricultural Chemistry Laboratory Network), and are presented in Table 2. At Nu’u 1, soil chemical analyses were repeated on samples taken immediately after harvest (March 2019), and analyses conducted at SROS. Sub-samples from Nu’u 1 and additional samples collected from Faleãlili immediately before harvest (March 2019) were packed and sent to the CSIRO Soil Physics Laboratory at Canberra for determination of the water retention curve (Figures 2 and 3 and Table 3).
| Determination | Unit | Nu’u 1 | Nu’u 2 | Faleãlili | Analytical method |
|---|---|---|---|---|---|
| Sand (>20 μm) | % (w/w) | 27.6 | 25.2 | 25.3 | Bouyoucos (1962) |
| Silt (2-20 μm) | % (w/w) | 42.3 | 43.4 | 52 | |
| Clay (<2 μm) | % (w/w) | 30.1 | 31.4 | 22.7 | |
| Textural class | - | Clay loam | Clay loam | Silt loam | Australian soil texture triangle |
| ρb | g cm-3 | 0.886 | - | 0.916 | Blake and Hartge (1986) |
| Cumulative infiltration | mm | Ft=363.3t-0.68 | - | - | Parr and Bertrand (1960) |
| Infiltration rate | mm h-1 | IR=204.28t-0.35 | - | - | Parr and Bertrand (1960) |
| Soil pH1:5 (soil/water) | - | 5.62 ± 0.56 | 6.6 | 4.5 | Rayment and Lyons (2011) |
| EC1:5 of soil (soil/water) | μS cm-1 | 2.92 ± 0.60 | - | - | Rayment and Lyons (2011) |
| SOC | % (w/w) | 3.30 ± 1.16 | 12.65 | 3.5 | Walkley and Black (1934) |
| Total N | % (w/w) | 0.66 ± 0.21 | 1.12 | 0.25 | Bremner (1960) |
| Soil extractable P | mg kg-1 | 2.69 ± 4.74 | 28.7 | 14.6 | Olsen et al. (1954) |
| Soil exchangeable K | cmol kg-1 | 0.46 ± 0.07 | 0.77 | 0.45 | MAFF (1986, Method No.: 63) |
Note: ρb=(dry) soil bulk density; EC=electrical conductivity of soil; SOC=soil organic carbon; N=nitrogen; P=phosphorus; K=potassium. Depth range: 0-150 mm. For particle size analysis, the soil was sieved and measurements conducted on the <2 mm fraction.
Table 2: Baseline characterization of soils at the experimental sites.

Figure 2: Soil water retention curves of the Nu’u 1 sites for three different depth intervals (0-150, 150-300 and 300- 600 mm). Blue dots show measured data points and black solid lines denote the fitted van Genuchten (1980) model. The van Genuchten model parameters α and η are shown in Table 5. Soil bulk density and measured datapoints are shown in Table 3.

Figure 3: Soil water retention curves of the Faleãlili sites for three different depth intervals (0-150, 150-300 and 300- 600 mm). Blue dots show measured data points and black solid lines denote the fitted van Genuchten (1980) model. The van Genuchten model parameters α and η are shown in Table 5. Soil bulk density and measured datapoints are shown in Table 3.
| Site | Depth | ρb | ψ (cm H2O) = | |||||||
|---|---|---|---|---|---|---|---|---|---|---|
| Units | (mm) | (g cm-3) | 0.1 | 10 | 30 | 50 | 100 | 300 | 600 | 15300 |
| - | - | - | -------------- | ---------- | θ(cm3 cm-3) | --------- | ----------- | |||
| Nu'u 1 | 0-150 | 0.876 | 0.6693 | 0.6538 | 0.5237 | 0.4625 | 0.3945 | 0.3162 | 0.2938 | 0.2081 |
| 150-300 | 0.885 | 0.6459 | 0.6027 | 0.5077 | 0.4648 | 0.4019 | 0.3143 | 0.2927 | 0.2079 | |
| 300-600 | 0.897 | 0.6418 | 0.6061 | 0.5522 | 0.4765 | 0.41 | 0.3137 | 0.2924 | 0.2052 | |
| Faleãlili | 0-150 | 0.874 | 0.6702 | 0.6702 | 0.5743 | 0.5146 | 0.4613 | 0.3618 | 0.3281 | 0.2269 |
| 150-300 | 0.916 | 0.6348 | 0.6142 | 0.552 | 0.4921 | 0.4304 | 0.3451 | 0.3163 | 0.2054 | |
| 300-600 | 0.958 | 0.6454 | 0.6386 | 0.5556 | 0.5275 | 0.4528 | 0.3502 | 0.3138 | 0.2043 |
Table 3: Measurement of soil water retention characteristics for the Nu’u 1 and Faleãlili sites (presented graphically in Figure 2; where: ρb is (dry) soil bulk density (g cm-3), ψ is water potential (cm H2O) and θ is volumetric water content (cm3 cm-3).
At all sites, the soils were classified as well-drained [12]. Before the experiments were established, both the Nu’u and Faleãlili sites had been used for taro production. Soil bulk density (ρb) was determined as per Blake and Hartge [13] by taking cores of 40 cm3 volume. The soil in the cores was then weighted, placed in an oven at 105°C for 72 hours, and re-weighted for determination of dry weight and gravimetric soil water content. Unconfined, saturated infiltration rates were measured in the field with the double-ring infiltrometer method [14]. Infiltration rates were obtained by differentiating Kostiakov’s function (Equation 1) with respect to time to describe the relationship between the rate of infiltration and time (Equation 2).
Ft = a × tn (1)
It = a × n × tn-1 (2)
Where Ft is cumulative infiltration (mm) at time t (h), and a and n are constants, and It is instantaneous water infiltration rate (mm h-1).
For soil water characterization, the relationship between soil water content and water potential was determined on intact soil cores with dimensions 50 mm diameter by 50 mm long. The cores were manually taken for the middle point of three depth intervals (0-150, 150-300, and 300-600 mm). Gravimetric soil water contents were determined at 0.1, 10, 30, 50, 100, 340, and 600 cm tensions using ceramic suction plates, and subsequently at 15 bar using a pressure plate apparatus, as described by McIntyre [15]. The laboratory determination of drained upper limit and crop lower limit was subsequently approximated by soil water contents measured at potentials of 100 cm (DUL100) and 15 bar (LL15), respectively. The difference between DUL100 and LL15 provides the laboratory determination of plant available water capacity for each soil interval [16]. When equilibration was reached, defined as a change in soil mass <0.05 g over a 24 h period, the soil cores were removed from the plates, weighed, and returned to the plates where the process was repeated for successive water potentials. After the 15-bar measurement was completed, the cores were placed in an oven at 105°C for 72 hours to determine the gravimetric water content at each incremental tension. The gravimetric water content was then expressed volumetrically by multiplying it by ρb. Dynamic changes in volume as a result of changes in water content were negligible and so the volume of soil used for density calculations equated the volume of the cylinder. The van Genuchten [17] functions were fitted to measured data to describe the relationship between soil water content (expressed volumetrically) and water potential (Equations 3-5). The van Genuchten model parameter α and exponent η were estimated based on the approach described by Ngo-Cong et al., [18,19].
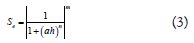
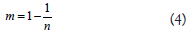
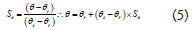
where Se is effective saturation, h is the pressure head (cm), θ is the soil water content, θs and θr are the saturated and residual water contents (all in cm3 cm-3), respectively, and α (cm-1) and η (dimensionless) are fitting parameters that describe the shape of the water retention function.
Crop measurements and analyses
Taro yield was determined by removing and weighting the eight central plants from each plot. The corms were then separated from the rest of the plant and weighted, and yield expressed as kg Dry Matter (DM) per ha (the average DM content of the taro corms was 35.67 ± 4.509%, w/w). Corm and total plant biomass were used to determine harvest Index expressed as percentage [20]. Nutrient off-take was estimated using elemental (N, P, K, Ca, Mg) concentrations in corm available in the literature for average crop yields in Samoa [6,21]. In our study, only the corms were removed from the field at harvest; the rest of the plant biomass was returned to the soil. Therefore, nutrient off-take equates to the corm biomass (DM basis) multiplied by the assumed elemental concentration and is expressed as kg (element) per ha, as shown by Antille et al., [22,23]. The field-scale nutrient balance was estimated from the difference between nutrient inputs (e.g., applied nutrients in amendments such as compost and fertilizer, and via nitrogen fixation in legume-intercropped taro) and nutrient outputs (off-take in corm).
Nutrient inputs for controls were assumed to be zero and so the nutrient balance was always negative (net off-take). For legume-intercropped taro, it was considered that in the year of establishment the legume plants would contribute about 50 kg N ha-1 per year. Reported N supply rates from intercropped legumes in taro crops ranged between 40 and 180 kg N ha-1 per year [24-26]. The rationale for choosing a N supply rate within the lower range of previously reported values was consistent with the stage of legumes development at the sites, and the fact that only about ⅓ to ½ of the area between-taro rows were covered by legumes (as determined by visual assessment at harvest). Differences in yield between amendment-treated or legume-intercropped taro and controls, relative to nutrient supplied as amendment or via N fixation, were used to denote the Agronomic Efficiency (AE), as shown in Equation (6) [20].
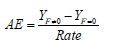
Where AE is agronomic efficiency (kg kg-1), YF≠0 and YF=0 are DM yields of amended-treated or legume-intercropped taro and control, and rate is the amount of given nutrient supplied as amendment or via N fixation, respectively (all in kg ha-1).
Soil measurements and analyses
Overall, there were no statistical differences before vs. after harvest or between control vs. treatments (legumes) in any of the soil parameters analyzed. The van Genuchten [17] model parameters, used for representing the relationship between soil water content (expressed volumetrically) and water potential, are presented in Table 4. Figures 2 and 3 shows the soil water retention characteristics for Nu’u 1 and Faleãlili. The volumetric water content measured at tensions of 100 cm of H2O and 15300 cm H2O (15 bar) are the laboratory determinations of drained upper limit (DUL100) and crop lower limit (LL15), respectively. Measured datapoints (from saturation to 15 bar) are reported in Table 3.
| Site | Depth | ρb | θS | θr | α | η | R2 | DUL100 | LL15 |
|---|---|---|---|---|---|---|---|---|---|
| Units | mm | g cm-3 | --- cm3 cm-3 --- | - | - | - | ---- cm3 cm-3 ---- | ||
| Nu'u 1 | 0-150 | 0.876 | 0.6812 | 0.2027 | 0.0522 | 1.5289 | 0.9949 | 0.3945 | 0.2081 |
| 150-300 | 0.885 | 0.6476 | 0.1827 | 0.0574 | 1.4235 | 0.9991 | 0.4019 | 0.2079 | |
| 300-600 | 0.897 | 0.6405 | 0.1913 | 0.0359 | 1.5212 | 0.9973 | 0.41 | 0.2052 | |
| Faleãlili | 0-150 | 0.874 | 0.6824 | 0.2006 | 0.0389 | 1.4374 | 0.9957 | 0.4613 | 0.2269 |
| 150-300 | 0.916 | 0.6397 | 0.1696 | 0.0391 | 1.3899 | 0.9982 | 0.4304 | 0.2054 | |
| 300-600 | 0.958 | 0.6513 | 0.1693 | 0.0313 | 1.4207 | 0.9978 | 0.4528 | 0.2043 |
Note: ρb=(dry) soil bulk density, θS and θr are saturation and residual soil water contents, α and η are the fitting parameters of the van Genuchten model (Equations 3-5), R2 is the coefficient of determination, and DUL100 and LL15 are laboratory measurements of drained upper limit and crop lower limit, respectively.
Table 4: The van Genuchten (1980) model parameters used for representing the relationship between soil water content (expressed volumetrically) and water potential of the Nu’u 1 and Faleãlili sites.
Crop measurements and analyses
Corm yields obtained at Nu’u 1 and Faleãlili are shown in Figure 4. At the Nu’u 1 site, overall statistical differences between control and legume-intercropped taro were not significant, and there were no differences between the Erythrina and Mucuna treatments (P-values >0.05). The average corm yield at Nu’u 1 (2730 kg DM ha-1) was 1370 kg DM ha-1 lower than the national average (≈4100 kg DM ha-1) recorded over the five-year period prior to these experiments [27]. The attainable corm yield in Samoa has been estimated at 6150 kg DM ha-1 (FAO, https://www.fao.org/3/ad513e/ad513e0c.htm#bm12.1). For rainfed cropping systems, the attainable yield is defined as that achieved through skillful use of the best available technology, and it may be regarded as an approximation of the water- limited yield [2,28]. From these results, and based on previously published data, it can be inferred that the yield gap between actual (field-measured) and attainable yields was approximately 3400 kg DM ha-1. Corm yields obtained at the Faleãlili site were only significant between Erythrina-intercropped taro and control (P<0.05), but differences were small. Differences between the two legume treatments, and between Mucuna and control were not significant (P>0.05). At Faleãlili, the yield gap between the average legume-intercropped taro (3340 kg DM ha-1) and the national average was estimated at 750 kg DM ha-1 and about 2800 kg DM ha-1 compared with the attainable yield.

Figure 4: Corm yields for the control and Erythrina and Mucuna treatments recorded at Nu’u 1 (A) and Faleãlili (B) in 2018-2019 and expressed in kg Dry Matter (DM) per ha. The box spans the interquartile range of the values in the variate (Q3-Q1) with the middle line indicating the median (Q2). Whiskers extend to the most extreme data values within the inner ‘fences’, which are at a distance of 1.5 times the interquartile range beyond the quartiles (or the maximum value if that is smaller). Individual outliers are identified with a green cross and ‘far’ outliers (beyond the outer ‘fences’) are at a distance of three times the interquartile range beyond the quartiles; Note: P>0.05 (Control vs. Treatment); P>0.05 (Treatment); LSD (5% level): 694.5; LSD (5% level): 748.8.
Results highlighted limited efficacy of legume intercropping as a strategy to increase the productivity of taro. Therefore, the use of legumes may be discouraged in lower fertility soils such as the Nu’u 1 site, which exhibited rather low soil extractable P levels (Table 2). When intercropping legumes with taro, the following management aspects may need to be considered:
• Intercropping will likely increase the risk of water deficits occurring; particularly, if due to the selected planting date, the crop cycle extends into the ‘dry’ season [29].
• Legumes will likely reduce the availability of soil P to the taro crop in soils that are under-supplied with P (e.g., Olsen’s P below 20 mg kg-1) [30,31], as legumes are known to take-up substantial amounts of P [32]. Similar effects may be encountered with other nutrients (e.g., K, Ca, Mg) if their levels in soil are below critical levels for growing taro.
• Low soil P supply will likely reduce N uptake by the taro crop because of significant N × P interaction on N uptake (regardless of N being available to the taro crop as a result of N fixation by the legume) [33,34].
• Soil application of P, whether as fertilizer or organic amendment, should account for P uptake by the legume (temporary immobilisation of P in legume biomass) when this is intercropped with taro. The same consideration applies to other key nutrients (e.g., K, Ca, Mg) used by legumes in fairly large quantities [35].
• Fertilisation strategies need to target nutrient requirements of both legume and taro crops so that N fixation (and N supply to the growing taro) is not compromised and plant uptake of other nutrients is not limited. However, this will require careful optimization of the system to ensure increased water use by legumes (due to the likely increased biomass in response to applied fertilizer) does not limit water (and therefore nutrient) uptake by the growing taro (co-limitation) [36-38].
There were no statistical differences in harvest Index between control and treatments or between-treatments, which was observed at both sites (P-values >0.05). Averaged across treatments, harvest Indexes were 53.1% (w/w) at Nu’u 1 and 58.7% (w/w) at Faleãlili (Figure 5).

Figure 5: Harvest indexes for the control and Erythrina and Mucuna treatments recorded at Nu’u 1 (A) and Faleãlili (B) in 2018-2019 and expressed in kg Dry Matter (DM) per ha. The box spans the interquartile range of the values in the variate (Q3-Q1) with the middle line indicating the median (Q2). Whiskers extend to the most extreme data values within the inner ‘fences’, which are at a distance of 1.5 times the interquartile range beyond the quartiles (or the maximum value if that is smaller). Individual outliers are identified with a green cross and ‘far’ outliers (beyond the outer ‘fences’) are at a distance of three times the interquartile range beyond the quartiles; Note: P>0.05 (Control vs. Treatment); P>0.05 (Treatment); LSD (5% level): 0.072; LSD (5% level): 0.0744.
Corm yields obtained at Nu’u 2 in 2020-2021 are shown in Figure 6. Overall, there were significant differences in corm yields between control and treatments (P<0.05), but amendment type (fertilizer vs. compost) or placement (surface-applied vs. incorporated) effects were not significant (P-values >0.05). On average, yields obtained in amendment-treated crop were about 950 kg DM ha-1 lower than the national average and about 40%-50% lower than the attainable yield for Samoa. Results obtained at Nu’u 2 suggested that the overall agronomic performance of amendment-treated crops was more constrained by management factors other than plant nutrition. Technical officers responsible for the field experiments were unable to visit the site while in COVID-19 lockdown. This meant that the experiments were unattended for extended periods and that routine crop protection measures (especially weed control) could not be appropriately performed, which therefore had adverse effects on yield and nutrient recovery. Yields at Nu’u 2 were within the range of yields recorded at Nu’u 1, which had been appropriately managed in terms of weed control despite that this site had had no nutrients applied (except for N derived from the intercropped legumes). The challenges faced by technical officers and field personnel during the 2020-2021 seasons were mostly outside their control. However, this increased growers and technical officers’ awareness of the need for ‘good’ crop husbandry if high-performing crops were to be produced. There appeared to be scope to increase actual (field-measured) yields by about 3000 kg DM ha-1 and the national average yield by about 2000 kg DM ha-1 if best management practices for nutrients and crop protection were to be implemented. Farming systems modeling (e.g., APSIM) may be applied to simulate the combined effects of balanced nutrition and soil water availability on crop performance, and determine management scenarios that will likely narrow yield gaps [39].

Figure 6: Corm yields for the control and compost (incorporated and surface application) and fertilizer (incorporated and surface application) treatments recorded at Nu’u 2 in 2020-2021 and expressed in kg Dry Matter (DM) per ha. The box spans the interquartile range of the values in the variate (Q3-Q1) with the middle line indicating the median (Q2). Whiskers extend to the most extreme data values within the inner ‘fences’, which are at a distance of 1.5 times the interquartile range beyond the quartiles (or the maximum value if that is smaller). Individual outliers are identified with a green cross and ‘far’ outliers (beyond the outer ‘fences’) are at a distance of three times the interquartile range beyond the quartiles; Note: P<0.05 (Control vs. Treatments); P>0.05 (Treatments); P>0.05 (Placement).
Harvest Indexes recorded at Nu’u 2 are shown in Figure 7. Mean values (from 0.578 to 0.606 kg kg-1) were within the range reported for the other two sites (Figure 7). Differences between control and treatments, and between-treatments (amendment type and placement) were not significant (P-values >0.05). Agronomic efficiency calculations for this site were: 11.3 kgDM kg-1 N, 38.9 kg DM kg-1 P, 10.9 kg DM kg-1 K for fertilizer-treated crop, and 12.3 kg DM kg-1 N, 62.2 kg DM kg-1 P, and 20.4 kg DM kg-1 K for compost-treated crop, respectively [40-45].

Figure 7: Harvest indexes for the control and compost (incorporated and surface application) and fertilizer (incorporated and surface application) treatments recorded at Nu’u 2 in 2020-2021 and expressed in kg Dry Matter (DM) per ha. The box spans the interquartile range of the values in the variate (Q3-Q1) with the middle line indicating the median (Q2). Whiskers extend to the most extreme data values within the inner ‘fences’, which are at a distance of 1.5 times the interquartile range beyond the quartiles (or the maximum value if that is smaller). Individual outliers are identified with a green cross and ‘far’ outliers (beyond the outer ‘fences’) are at a distance of three times the interquartile range beyond the quartiles; Note: P>0.05 (Control vs. Treatments); P>0.05 (Treatments); P>0.05 Placement.
Table 5 shows the elemental nutrient composition used to derive nutrient off-take, which was subsequently used with DM yield data to provide field-scale nutrient balance estimates. Figures 8 and 9 show the estimated nutrient off-take for the three experimental sites based on the taro corm yields reported in Figures 4 and 6, and the average elemental composition of taro corms presented in Table 5. Given that treatment differences in yield encountered at Nu’u 1 and Faleãlili were not significant (except for the small yield difference between control and Erythrina at the Faleãlili site), nutrient off-take data were consolidated into single figures per site. For Nu’u 2, nutrient off-take data are presented by amendment type as other treatment effects (amendment placement) on yield were not significant (Figure 9).

Figure 8: Estimated nutrient off-take in taro corms at Nu’u 1 (A) and Faleãlili (B) in 2018-2019 and expressed in kg Dry Matter (DM) per ha. The box spans the interquartile range of the values in the variate (Q3-Q1) with the middle line indicating the median (Q2). Whiskers extend to the most extreme data values within the inner ‘fences’, which are at a distance of 1.5 times the interquartile range beyond the quartiles (or the maximum value if that is smaller). Individual outliers are identified with a green cross and ‘far’ outliers (beyond the outer ‘fences’) are at a distance of three times the interquartile range beyond the quartiles; Note: a) Nu'u, b) Falealili.

Figure 9: Estimated nutrient off-take in taro corms at Nu’u 2 in 2020-2021; (A): Control (zero-amendment), (B): Compost and (C) NPK+S fertilizer applied at 50 g (product) per plant and expressed in kg Dry Matter (DM) per ha. The box spans the interquartile range of the values in the variate (Q3-Q1) with the middle line indicating the median (Q2). Whiskers extend to the most extreme data values within the inner ‘fences’, which are at a distance of 1.5 times the interquartile range beyond the quartiles (or the maximum value if that is smaller). Individual outliers are identified with a green cross and ‘far’ outliers (beyond the outer ‘fences’) are at a distance of three times the interquartile range beyond the quartiles; Note: a) Control, b) Compost, c) NPK+S
| Element | Unit | Mean concentration ± SD |
|---|---|---|
| Nitrogen, N | %, w/w (dry basis) | 0.76 ± 0.142 |
| Phosphorus, P | %, w/w (dry basis) | 0.24 ± 0.012 |
| Potassium, K | %, w/w (dry basis) | 1.45 ± 0.289 |
| Calcium, Ca | %, w/w (dry basis) | 0.10 ± 0.025 |
| Magnesium, Mg | %, w/w (dry basis) | 0.15 ± 0.021 |
Note: Values compiled and averaged from multiple sources. SD is standard deviation. Mean taro corm DM was 35.67 ± 4.51% (w/w).
Table 5: Elemental composition of taro corms used to estimate nutrient off-take at harvest.
The information presented in Figures 8 and 9 was subsequently used to provide field-scale nutrient balance estimates for five major elements (Figure 10). Based on the assumptions made in the analyses, these estimates resulted in negative balances across all five nutrients when legumes were intercropped with taro, including for N. The apparent N, P, and K surplus estimated at Nu’u 2 for fertilizer- and compost-treated taro crops did not correspond with the yields recorded at this site. This suggested that corm yields were more constrained by factors other than nutritional (importantly weed control) and that any apparent nutrient surplus was due to poor use efficiency of applied nutrients, whether as compost or fertilizer. Average nutrient off-take ratios were, approximately, 6:2:11:1:1 (N:P:K:Ca:Mg), which may be used as guidance for fertilizing taro crops if the strategy was to work on a nutrient replacement basis.

Figure 10: Estimated field-scale (macro) nutrient balance at three experimental sites as affected by nutrient management practice, From left to right, (A): Nu’u 1 (2018- 2019), (B): Faleãlili (2018-2019), and (C): Nu’u 2 (2020-2021). In figures (A) and (B), the letters (L) and (C) following the nutrient symbol denote ‘legume’ intercropping and ‘control’, respectively. In figure (C), ‘fertilizer’ is NPK+S (12:8:15+3, commercially known as Blaukorn Classic®) and ‘compost’ is composted poultry manure (>¾ by weight).
The experimental work reported in this paper investigated field-scale nutrient cycling in rainfed taro production systems and demonstrated the importance of nutrient budgeting for long-term soil fertility management. This work made it possible to quantify field-scale nutrient balances and communicate research findings to government agencies (e.g., Samoan Ministry of Agriculture and Fisheries), scientific organizations (e.g., SROS, The University of the South Pacific), and local growers, extension officers, and agronomists. The main conclusions derived from this work are summarized below:
Soil fertility and soil organic carbon
There were no significant changes in any of the measured soil parameters as determined before and after growing taro. Significantly lower SOC and nutrient levels and soil pH at Nu’u 1 and Faleãlili compared with Nu’u 2 were attributed to the relative number of years under continuous cropping at these sites (Nu’u 2 was a newer site with less than 3 years of cropping). Differences in SOC, soil pH and nutrient levels (especially total N and Olsen’s P) between these sites suggested high vulnerability to rundown of soil fertility; particularly, when soils are used for cropping without significant carbon and nutrient inputs.
Legume intercropping: The amount of N supplied via fixation (40-60 kg ha-1) was insufficient to meet taro crop demand for N. Temporary immobilization of P in crop biomass is likely to be significant and may therefore reduce P availability to the taro crop during the growing season. This can compromise N and K uptake and affect crop water-use (rainfall-use efficiency). These effects can be more significant in lower fertility soils and soils with low water holding capacity. When legumes are intercropped with taro, the fertilization program should account for nutrient demands of both crops. However, this will require careful optimization of the system to ensure increased water use by legumes (due to increased biomass in response to applied fertilizer) does not limit water and nutrient uptake by the growing taro crop.
Mineral and organic amendments: The nutrient balance was negative when legumes were used. Apparent surpluses of N, P, and K at Nu’u 2, when either compost or fertilizer were used, were explained by low corm yields and therefore poor nutrient use efficiencies (recovery in corm biomass), and lack of weed control over the season. Despite this, corm yields were higher in amended (compost or fertilizer) treated taro compared with legume intercropping. The country’s attainable yield (6150 kg DM ha-1) may not be achieved without balanced application of nutrients and proper weed control.
Agronomic performance: Corm yields were lower than the national average and the estimated yield gap (difference between actual and attainable yields) was wide. Yields obtained with surface application were similar to soil incorporation, which suggested different nutrient loss mechanisms may be driving such effects (e.g., increased volatilization, and possibly runoff, when applied on the surface, and increased leaching when incorporated-this may be possible because of the high permeability and infiltration rates observed in these soils). Appropriate fertilization coupled with best management practice for weed control and crop protection can significantly narrow current yield gaps.
Nutrient management framework: A framework to guide nutrient recommendations for taro needs to be developed. Under this framework, Nitrogen (N) recommendations should be derived from yield-to-N response functions while for other nutrients (e.g., P, K, Ca, and Mg) recommendations should be based on replacement. Knowledge of the yield-to-N response relationship will enable derivation of the most economic rate of N, which will ensure the economic return from N applied at this rate will be maximized. The replacement strategy adopted for other nutrients will require the development of soil Indexes. These Indexes can be used to define the long-term nutrient management policy at a given site or field that can help farmers, farm advisors and extension officers make better fertilizer and nutrient decisions to improve the productivity and sustainability of agriculture in Samoa. This long-term policy is informed by soil analyses, and it will determine when soil nutrients levels need to be built-up or maintained, or whether application can be omitted in some years (for example, when nutrient levels are within a range that is satisfactory both from agronomic and environmental perspectives).
This research received financial support from the Australian Centre for International Agricultural Research (Australian Government, https://www.aciar.gov.au/, Project ID: SMCN/2016/111), and the Department of Foreign Affairs and Trade (Australian Government, https://www.dfat.gov.au/, SciTech4Climate: Indo-Pacific Climate-Smart Agriculture Initiative). Further details about the work jointly conducted by CSIRO, its partner organizations, and ACIAR in Pacific Countries and Territories can be found at: https://research.csiro.au/pacsoils/, including the development of an open access soils information system known as The Soils Portal: https://research.csiro.au/pacsoils/our-research/digital-soil-portal/.
The authors acknowledge the operational support provided by The Scientific Research Organization of Samoa (SROS, https://sros.org.ws/), The Ministry of Agriculture and Fisheries of Samoa (MAF, https://maf.gov.ws/), Manaaki Whenua Landcare Research (New Zealand), The Pacific Community (SPC, https://www.spc.int/), extension officers and technical personnel from MAF and SROS, and local taro growers. Help received from Mr G. McLachlan and Mrs S. Tuomi (CSIRO Agriculture and Food, Canberra) is gratefully acknowledged.
[Crossref] [Google Scholar] [PubMed]
[Crossref] [Google Scholar] [Pubmed]
[Crossref]
Citation: Antille DL, Uelese A, Tugaga A, et al. Agronomic response of rainfed taro to improved soil and nutrient management practices in Samoa. AGBIR.2023;39(5):641-650.
Received: 01-Jul-2023, Manuscript No. AGBIR-23-105359; Accepted: 31-Jul-2023, Pre QC No. AGBIR-23-105359 (PQ); Editor assigned: 03-Jul-2023, Pre QC No. AGBIR-23-105359 (PQ); Reviewed: 17-Jul-2023, QC No. AGBIR-23-105359; Revised: 24-Jul-2023, Manuscript No. AGBIR-23-105359 (R); Published: 01-Sep-2023, DOI: 10.35248/0970-1907.23.39.641-650
Copyright: This open-access article is distributed under the terms of the Creative Commons Attribution Non-Commercial License (CC BY-NC) (http:// creativecommons.org/licenses/by-nc/4.0/), which permits reuse, distribution and reproduction of the article, provided that the original work is properly cited and the reuse is restricted to noncommercial purposes. For commercial reuse, contact reprints@pulsus.com This is an open access article distributed under the terms of the Creative Commons Attribution License, which permits unrestricted use, distribution, and reproduction in any medium, provided the original work is properly cited.


